Advanced task distribution in Slurm

The ITSR team recommend most Apocrita users submit job scripts for multi-task workloads according to the default recommendations in our documentation, but some specific workloads need additional specifications in Slurm job scripts.
Default Slurm task distribution
The following advice only applies to certain workloads
The issues and recommendations that follow don't apply universally to all cluster workloads. We advise users to stick to the default recommendations in our documentation, and only follow the advice below in response to a specific need.
By default, Slurm will allocate requested tasks for single node jobs (which is the majority of jobs users run on Apocrita) in a cyclic fashion, balancing the number of tasks requested across CPU sockets available in the node that runs them:
When using a
SelectTypeofselect/cons_tres... the default allocation method within a node is cyclic allocation (allocate available CPUs in a round-robin fashion across the sockets within a node).
Our most common type of node is a DDY, which contains 2x 24 core Intel Xeon CPUs in two sockets, for a total of 48 available cores:
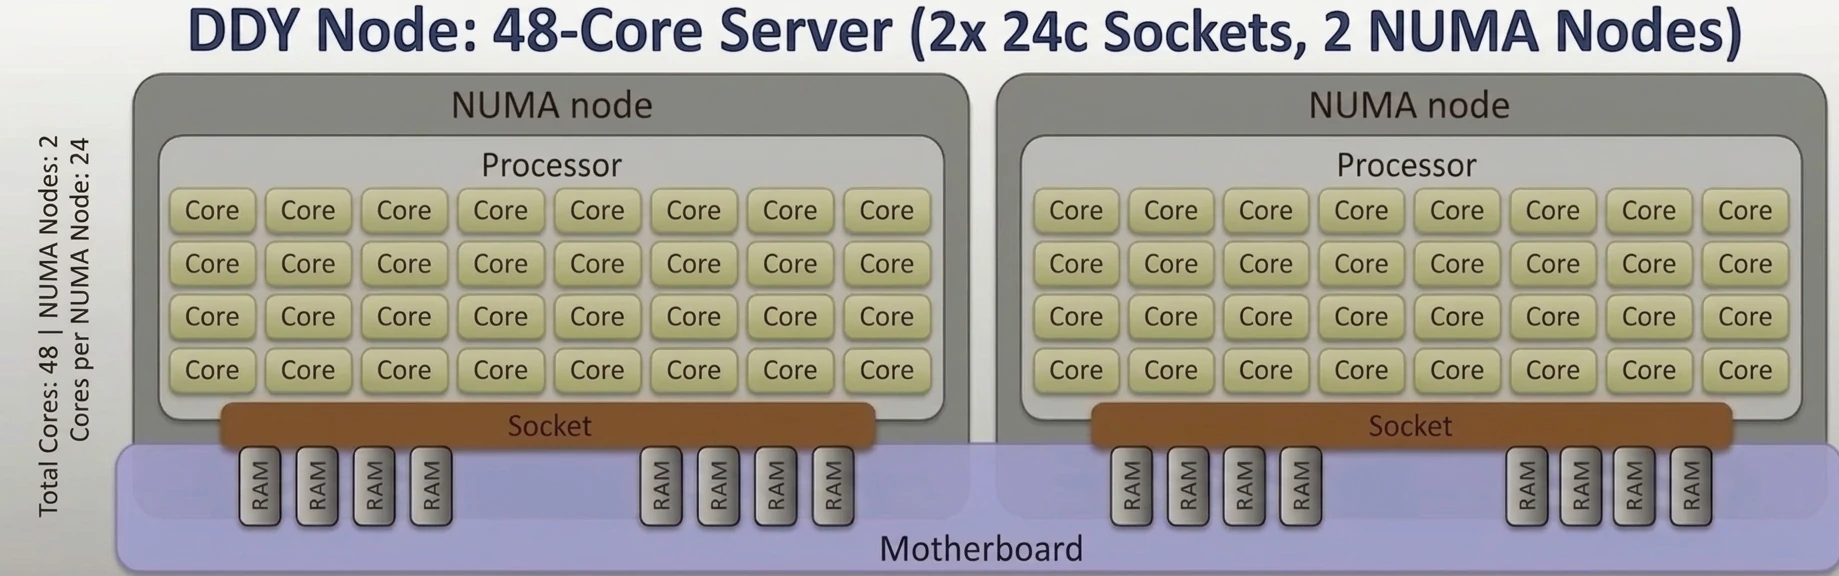
CPU layout for a DDY node
(it also contains two "NUMA nodes", but we will return to these later in this post)
NUMA domains vs NUMA nodes
A lot of documentation uses the terms "NUMA domain" and "NUMA node" interchangeably to mean the same thing - a subsection of CPUs and memory in a node that are grouped together.
Let's request a standard
salloc
interactive session on the cluster, requesting 8 tasks on a DDY node:
$ salloc --constraint=ddy -n 8
salloc: Pending job allocation 12345678
salloc: job 12345678 queued and waiting for resources
salloc: job 12345678 has been allocated resources
salloc: Granted job allocation 12345678
salloc: Nodes ddy179 are ready for job
[ddy179 ~]$
We've landed on ddy179. Two small commands can help us here. First, we can
extract some useful information using the lscpu command (contracted for
brevity):
[ddy179 ~]$ lscpu
...
CPU(s):                      48
  On-line CPU(s) list:       0-47
...
  Model name:                Intel(R) Xeon(R) Platinum 8268 CPU @ 2.90GHz
...
    Thread(s) per core:      1
    Core(s) per socket:      24
    Socket(s):               2
...
NUMA:
  NUMA node(s):              2
  NUMA node0 CPU(s):         0-23
  NUMA node1 CPU(s):         24-47
As in previous diagram above, we can see 48 CPUs, 2 sockets, 2 NUMA nodes, 24 cores per socket/NUMA node.
Another useful command, taskset, can tell us which of these CPUs have been
allocated to our job:
[ddy179 ~]$ taskset -pc $$
pid 1897827's current affinity list: 5,6,17,18,30,35,37,46
That's cores 5,6,17,18 from the first socket/NUMA node, and cores
30,35,37,46 from the second socket/NUMA node. So that's a cyclic
distribution of our 8 requested tasks, balanced across both sockets/NUMA
nodes. For most users, this is absolutely fine.
Modifying Slurm task distribution
Whilst Slurm's default cyclic task allocation is acceptable for most of our
users, some specific workloads may suffer performance degradation if the tasks
are distributed across sockets/NUMA nodes. In these cases, it is possible to
modify the way Slurm distributes tasks in your job scripts and salloc
requests.
As an example, let's say we wanted Slurm to assign all 8 tasks to a single socket/NUMA node. We would need to add:
--distribution=block:block- this tells Slurm to attempt to assign cores in a continuous block. However, this is only a suggestion, and if you want to enforce this distribution, you should also add the additional arguments below--sockets-per-node- this tells Slurm to schedule all tasks into the number of sockets specified--cores-per-socket- this tells Slurm to schedule the specified number of cores per socket
Let's add the above arguments into our previous 8 task salloc example above:
The commands below can also be used when submitting job scripts
The salloc arguments below can also be added to job scripts as #SBATCH
lines.
salloc \
  --constraint=ddy \
  -n 8 \
  --distribution=block:block \
  --sockets-per-node=1 \
  --cores-per-socket=8
We're requesting 8 tasks on a DDY node with block distribution, a single socket
and asking for all 8 tasks to be in that same single socket. Note, this may
increase queueing time for your salloc session or job script, as you wait for
a node with this specific resource request to become available.
salloc: Pending job allocation 12345678
salloc: job 12345678 queued and waiting for resources
salloc: job 12345678 has been allocated resources
salloc: Granted job allocation 12345678
salloc: Nodes ddy127 are ready for job
[ddy127 ~]$ lscpu | grep -i numa
NUMA node(s):                            2
NUMA node0 CPU(s):                       0-23
NUMA node1 CPU(s):                       24-47
[ddy127 ~]$ taskset -pc $$
pid 1670915's current affinity list: 26,28,32,34,39,43,44,47
This time we have been given a block of CPUs that are all in the same
socket/NUMA node (node1).
Case study: STAR-CCM+
To give a more concrete example of where this might be more of a problem, let's look at an example STAR-CCM+ job script:
#!/bin/bash

#SBATCH -n 48
#SBATCH -p compute
#SBATCH -t 240:0:0
#SBATCH --mem-per-cpu=1G

# Module load
module load starccm/2506

lscpu | grep -i numa
echo "Assigned cores: $(taskset -pc $$)"

starccm+ -batchsystem slurm -batch input.sim
In this case, if this job were to hit a DDY node, it would be requesting all CPUs on that node, meaning worries about CPU affinity, task distribution and NUMA nodes somewhat fade away.
Here is that job's runtime and contracted output on a DDY node, using the
reportseff tool to help us:
$ reportseff --format=jobidraw,timelimit,elapsed,reqmem,MaxRSS,MemEff,reqcpus,CPUEff,nodelist,state 12345678
 JobIDRaw    Timelimit    Elapsed    ReqMem   MaxRSS   MemEff   ReqCPUS   CPUEff   NodeList     State
 12345678   10-00:00:00   10:01:07    48G      14G     28.9%      48      99.2%     ddy60     COMPLETED

$ head -n 10 slurm-12345678.out
NUMA node(s):                            2
NUMA node0 CPU(s):                       0-23
NUMA node1 CPU(s):                       24-47
Assigned cores: pid 1879812's current affinity list: 0-47
Starting local server: /share/apps/rocky9/general/apps/starccm/20.04.008-R8/STAR-CCM+20.04.008-R8/star/bin/starccm+ -batchsystem slurm -server  -xencoded-session U09QX1JfZmNfdjJfNjUwX1JBTlMuc2lt
MPI Distribution : Open MPI-5.0.6
Host 0 -- ddy60 -- Ranks 0-47
Process rank 0 ddy60 1894183
Total number of processes : 48
So, very good CPU efficiency and confirmation that we used all 48 cores on the node.
EHC nodes
Slurm treats NUMA nodes as sockets
Apocrita's Slurm configuration sets the
numa_node_as_socket
option for
SlurmdParameters:
$ grep SlurmdParameters /etc/slurm/slurm.conf
SlurmdParameters=numa_node_as_socket
Where we can run into issues with this job is our newer EHC nodes. These nodes contain 2x 192 core AMD EPYC CPUs in two sockets but four NUMA nodes, for a total of 384 available cores:
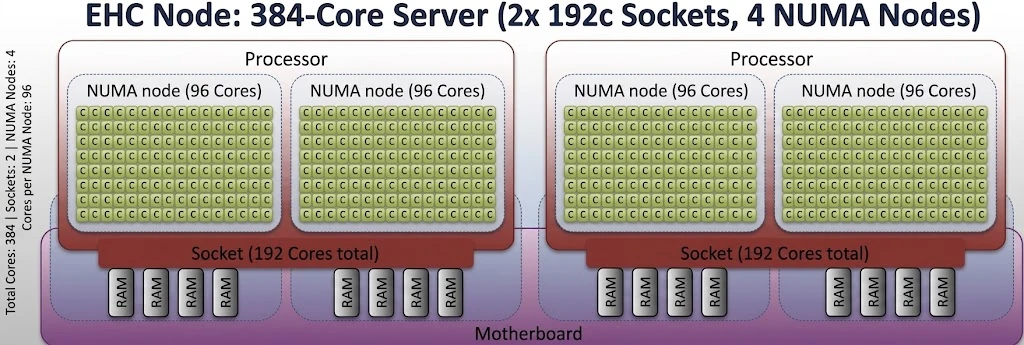
CPU layout for an EHC node
Let's return to our previous 8 task salloc example, but specifically request
an EHC node:
$ salloc --constraint=ehc -n 8
salloc: Granted job allocation 12345678
salloc: Waiting for resource configuration
salloc: Nodes ehc2 are ready for job
[ehc2 ~]$ lscpu
...
CPU(s):                      384
  On-line CPU(s) list:       0-383
...
  Model name:                AMD EPYC 9965 192-Core Processor...
    Thread(s) per core:      1
    Core(s) per socket:      192
    Socket(s):               2
...
NUMA:
  NUMA node(s):              4
  NUMA node0 CPU(s):         0-95
  NUMA node1 CPU(s):         96-191
  NUMA node2 CPU(s):         192-287
  NUMA node3 CPU(s):         288-383

[ehc2 ~]$ taskset -pc $$
pid 3833485's current affinity list: 113,119,176,178,179,310,319,337
Here, we've been given CPUs 113,119,176,178,179 from NUMA node1 and
CPUs 310,319,337 from NUMA node3.
If we refine our distribution request:
salloc \
  --constraint=ehc \
  -n 8 \
  --distribution=block:block \
  --sockets-per-node=1 \
  --cores-per-socket=8
Then, we get all CPUs in the same NUMA node:
salloc: Pending job allocation 12345678
salloc: job 12345678 queued and waiting for resources
salloc: job 12345678 has been allocated resources
salloc: Granted job allocation 12345678
salloc: Waiting for resource configuration
salloc: Nodes ehc6 are ready for job
[ehc6 ~]$ lscpu | grep -i numa
NUMA node(s):                            4
NUMA node0 CPU(s):                       0-95
NUMA node1 CPU(s):                       96-191
NUMA node2 CPU(s):                       192-287
NUMA node3 CPU(s):                       288-383
[ehc6 ~]$ taskset -pc $$
pid 3214078's current affinity list: 293,321,323,327,334,336,374,376
This time we get CPUs 293,321,323,327,334,336,374,376, which are
all in NUMA node3.
STAR-CCM+ on EHC nodes
At higher task counts, requested tasks can end up very widely scattered across NUMA nodes on EHC nodes. If the previous job script runs on an EHC node as written, you end up with something more like this:
$ reportseff --format=jobidraw,timelimit,elapsed,reqmem,MaxRSS,MemEff,reqcpus,CPUEff,nodelist,state 12345678
 JobIDRaw    Timelimit    Elapsed    ReqMem   MaxRSS   MemEff   ReqCPUS   CPUEff   NodeList     State
 12345678   10-00:00:00   10:26:25    48G      14G     29.0%      48      33.0%      ehc8     COMPLETED

$ head -n 11 slurm-12345678.out
NUMA node(s):                            4
NUMA node0 CPU(s):                       0-95
NUMA node1 CPU(s):                       96-191
NUMA node2 CPU(s):                       192-287
NUMA node3 CPU(s):                       288-383
Assigned cores: pid 2311552's current affinity list: 13,27,29,30,35,37,45,49,50,52,53,56,66,70-72,109,135,141,178,192,193,195,201,219,235,239,249,253,254,257,273,274,304,323,337,338,340,342-344,346,352,354,356,360-362
Starting local server: /share/apps/rocky9/general/apps/starccm/20.04.008-R8/STAR-CCM+20.04.008-R8/star/bin/starccm+ -batchsystem slurm -server  -xencoded-session U09QX1JfZmNfdjJfNjUwX1JBTlMuc2lt
MPI Distribution : Open MPI-5.0.6
Host 0 -- ehc8 -- Ranks 0-47
Process rank 0 ehc8 2326171
Total number of processes : 48
So that's CPUs:
13,27,29,30,35,37,45,49,50,52,53,56,66,70-72from NUMAnode0109,135,141,178from NUMAnode1192,193,195,201,219,235,239,249,253,254,257,273,274from NUMAnode2304,323,337,338,340,342-344,346,352,354,356,360-362from NUMAnode3.
Because the tasks and memory locality are fragmented across all four NUMA nodes, the job performance plummets.
If we resubmit this job with the following additions to the #SBATCH section:
#SBATCH --constraint=ehc
#SBATCH --distribution=block:block
#SBATCH --sockets-per-node=1
#SBATCH --cores-per-socket=48
then we see performance return to expected levels:
$ reportseff --format=jobidraw,timelimit,elapsed,reqmem,MaxRSS,MemEff,reqcpus,CPUEff,nodelist,state 12345678
 JobIDRaw    Timelimit    Elapsed    ReqMem   MaxRSS   MemEff   ReqCPUS   CPUEff   NodeList     State
 12345678   10-00:00:00   10:01:07    48G      14G     29.3%      48      99.1%      ehc1     COMPLETED

# head -n 11 slurm-12345678.out
NUMA node(s):                            4
NUMA node0 CPU(s):                       0-95
NUMA node1 CPU(s):                       96-191
NUMA node2 CPU(s):                       192-287
NUMA node3 CPU(s):                       288-383
Assigned cores: pid 686283's current affinity list: 193-196,200-202,204,205,208,209,213-217,220-222,224,227,229,230,232-234,236,237,243,245-248,251-256,259,261,263-265,267,268,270,271
Starting local server: /share/apps/rocky9/general/apps/starccm/20.04.008-R8/STAR-CCM+20.04.008-R8/star/bin/starccm+ -batchsystem slurm -server  -xencoded-session U09QX1JfZmNfdjJfNjUwX1JBTlMuc2lt
MPI Distribution : Open MPI-5.0.6
Host 0 -- ehc1 -- Ranks 0-47
Process rank 0 ehc1 705386
Total number of processes : 48
This is because all tasks have been assigned to CPUs in NUMA node2
(192-287).
Note, we added --constraint=ehc to the second job because we can
get a single NUMA nodes containing 48 CPUs (unlike a DDY node, which only has
24 CPUs per NUMA node). When adding CPU distribution arguments to job scripts,
we recommend specifying a node
constraint so that your
distribution request and node type match up. You can check available constraints
using:
sinfo --partition=compute --Format=NodeHost:10,Partition:15,Features:50
The AVAIL_FEATURES column will list the constraints that can be applied (for
nodes in the compute partition this is usually just the node type in
lower-case, e.g. ""ddy""):
$ sinfo --partition=compute --Format=NodeHost:10,Partition:15,Features:50
HOSTNAMES PARTITION      AVAIL_FEATURES
ddy28     compute*       ddy
ddy29     compute*       ddy
ddy41     compute*       ddy
(etc.)
Adding node constraints and task distribution may increase queueing
Requesting specific node types and task distribution may increase queueing
time for your jobs, particularly when requesting larger task counts and
limiting them to a single NUMA node, as you will be waiting for a block
of CPUs to become available. We recommend benchmarking your jobs accordingly
to find the best approach, using the
jobstats,
seff and/or
reportseff (install in a
personal Python Environment) tools to help you.
STAR-CCM+ performance impact
Below is a comparison of the STAR-CCM+ timesteps for a default scattered core cyclic distribution (similar to our first EHC example job above, blue line - "Slow Simulation") and mindful block distribution (similar to our second EHC example job above - orange line - "Fast Simulation"):
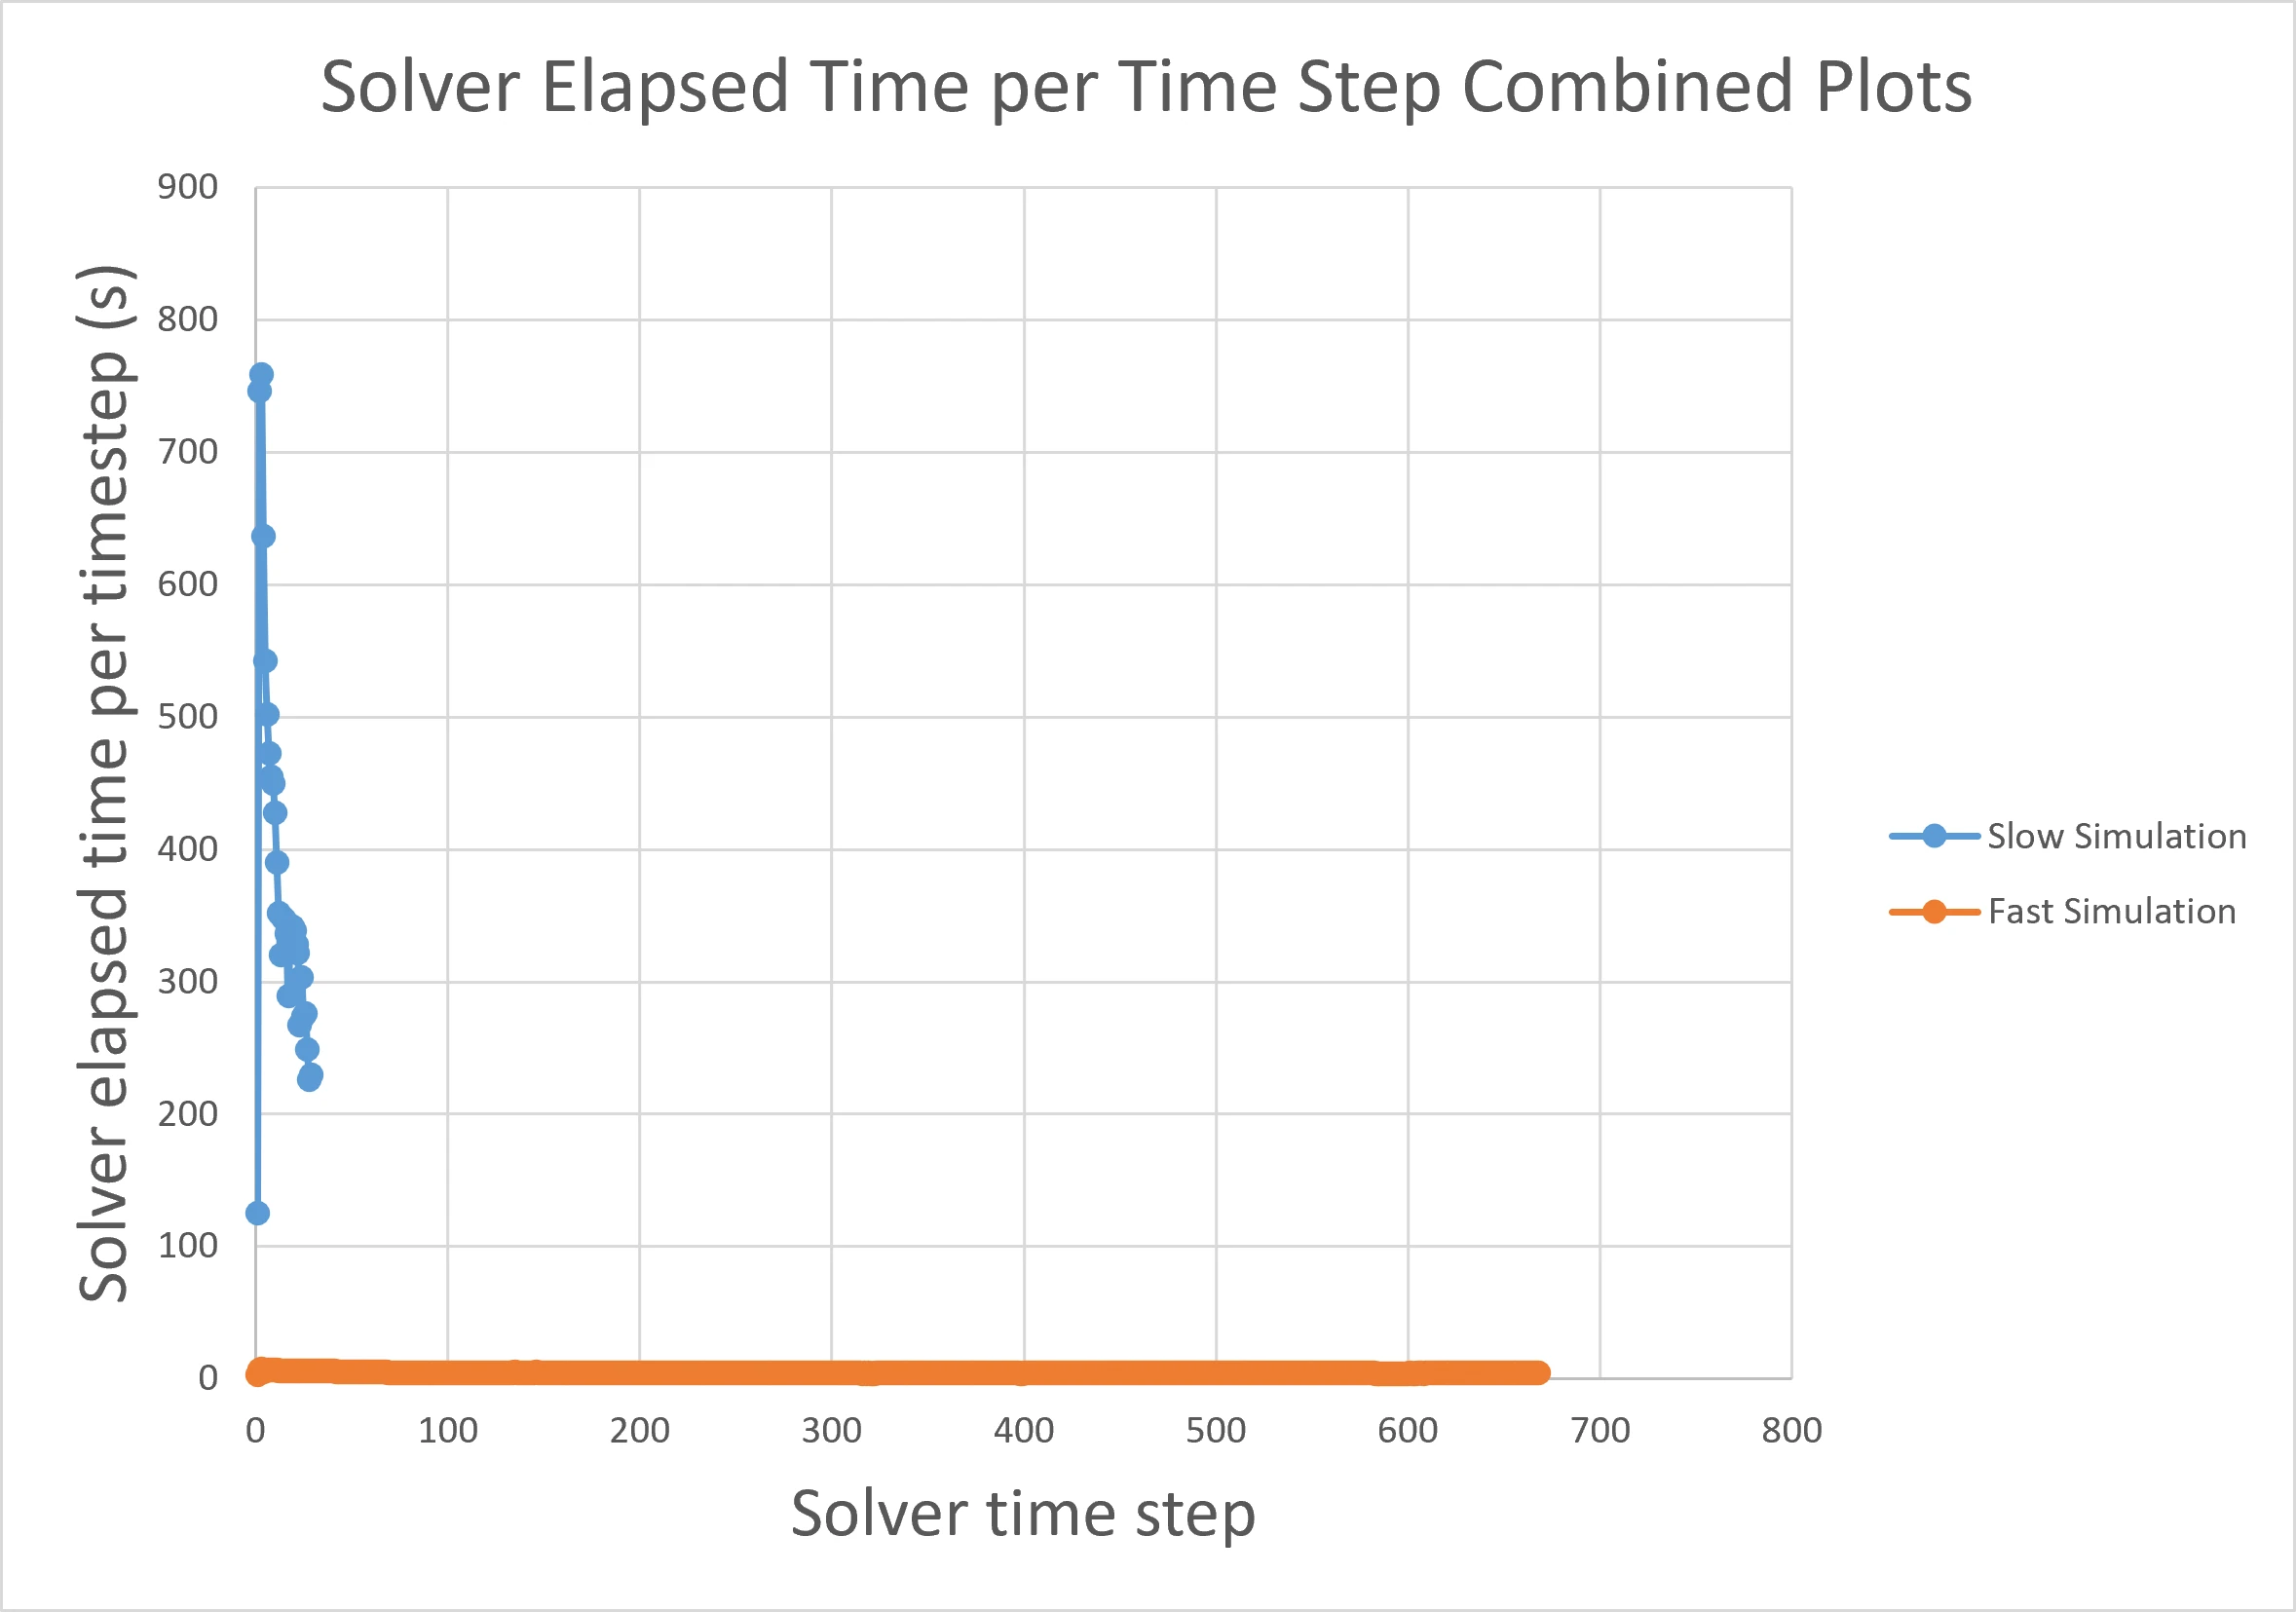
Performance comparison for STAR-CCM+
This came from a cluster user, who reported:
The Slow Simulation advanced 29 timesteps in 3 hours of cluster runtime, requiring hundreds of seconds to compute one timestep. Meanwhile the Fast Simulation required only ~4 seconds to compute each timestep and advanced 668 time steps in 51 minutes of runtime on the cluster. This is for a small test simulation, the problem is exacerbated when simulations require a larger mesh.
So in the case of this specific workload, tasks scattered across CPUs in all NUMA nodes causes a significant degradation in performance.
Conclusion
Hopefully the above example has given you some insight into how you might be
able to adjust your job submission requests when your workloads require it.
Remember, many workloads won't need these additional arguments, so best to
stick to not using them unless you identify a specific need. A good place to
start is to use the
jobstats,
seff and/or
reportseff (install in a personal
Python Environment) tools to identify jobs that may
benefit from more specific distribution/allocation.
The examples above are also not the only way to divide tasks up. It's also possible to specify a multiplier combination of tasks and cpus-per-task when using hybrid MPI/OpenMP workloads, for example.
Further detailed information about Slurm distribution and binding can be found in the References section below.
If you have any questions regarding Slurm distribution and binding, please contact us on our Slack channel (QMUL users only), or by sending an email to its-research-support@qmul.ac.uk which is handled directly by staff with relevant expertise.
References
- Slurm CPU Management User and Administrator Guide
- Slurm Support for Multi-core/Multi-thread Architectures
- LUMI Documentation - Distribution and binding options
- ZIH HPC Compendium - Binding and Distribution of Tasks
Title image: EpycProcessor.jpg CC0 1.0
