Sizing your Apocrita jobs for quicker results

At any one time, a typical HPC cluster is usually full. This is not such a bad thing, since it means the substantial investment is working hard for the money, rather than sitting idle. A less ideal situation is having to wait too long to get your research results. However, jobs are constantly starting and finishing, and many new jobs get run shortly after being added to the queue. If your resource requirements are rather niche, or very large, then you will be competing with other researchers for a more scarce resource. In any case, whatever sort of jobs you run, it is important to choose resources optimally, in order to get the best results. Using fewer cores, although increasing the eventual run time, may result in a much shorter queuing time.
Two aspects to consider are the available hardware, and the current state of the queues.
Cluster hardware
The Apocrita cluster is formed of groups of different node types, of varying age. This is due to the funding model of smaller regular income, as opposed to, say a Regional HPC cluster, funded from an initial large payment and designed for a more narrow scope of work. In order to meet the needs of the diverse Research Community at Queen Mary, it is also sometimes necessary to provide differing hardware specifications to efficiently run specialist workloads. In addition to the general-purpose worker nodes, there are also nodes with GPU accelerators, and others with large amounts of RAM.
The docs page provides an overview of the different node types. The cluster is broken down into:
- Niche nodes (high RAM, GPU)
- Public nodes dedicated to "large" (parallel) jobs, each job using several nodes exclusively
- Public nodes dedicated to "small" (serial or single node SMP) jobs
- Restricted nodes, which have been funded directly by a research grant, and access is restricted to a defined group of users.
Job types
Parallel jobs run on multiple nodes simultaneously, using low-latency infiniband networking, and specially designed applications (typically using the MPI protocol).
Serial/smp jobs are tasks which use 1 or more processors on a node. The scheduler allocates your requested resources and allowing other jobs to run on the remaining resources on a node at the same time. Since several small jobs may be sharing a single node, each starting and finishing at different times, the serial nodes and parallel nodes are kept separate, to avoid blocking parallel jobs, which require exclusive node access.
Additionally, jobs which run for less than 1 hour are allowed to run on restricted nodes. This concession allows users to rapidly get an interactive session for troubleshooting & testing, or to run a series of small jobs that would otherwise have a disproportionate queuing time to runtime ratio.
Assessing the current queue status
The Univa Grid Engine scheduler has a few
built-in commands
to check queue status. However, at QMUL we have added custom commands which
present the output in a more readable fashion.
Assuming you are logged in to a frontend node, then the built-in command
qstat will immediately show your own running and queued jobs.
To see how your queued jobs compare with the other users of the system, use the
custom showqueue command to provide a list of all waiting jobs. If there are
any maintenance jobs waiting, you will probably want to exclude this from your
output with -e maintuser, and we will also want to see the full output with
-F which is a bit slower to process, but shows the additional parameters
supplied to the job. showqueue -h will show all available options.
Use of the grep command can perform additional filtering as desired. For
example, showqueue -F -e maintuser | grep -v parallel, will not show any
lines containing the word parallel, if you are only interested in smp jobs.
Interpreting showqueue output
Firstly, it's important to understand the columns of the output from showqueue
- Job-ID - The unique job id, which will also allow us to run
qstat -j
  <jobid>
to find out more detail about the specific job. - Prior - The job's priority, or position, in the queue (higher is better). The queues are configured to try to be as fair as possible, and the main factor governing your position in the queue is the submission time. As with real-life queues, the ones waiting for longest are nearest the front.
- User - Username of the person submitting the job. Running the
finger
  <username>
command will give you their real name. - Group - This is your QMUL department, for statistical gathering, but has no impact on your position in the queue
- State - State of the queued job - this will either be:
qw- Queued, waiting to runEqw- Suffered a fundamental system error during execution and could not complete (e.g. job failed because the directory didn't exist). The job needs checking and either deletingqdel <jobid>or requeuing after resolving the issue withqmod -cj <jobid>hqw- The job has been manually held by the user or administrator, and will not run until manually released. This can be useful if you submitted a batch of jobs but discover an issue that needs to be resolved before further jobs run. Alternatively, a job may be inhqwstate if the user has utilised thehold_jidoption in their job script, which blocks a job or jobs from running until a specific job it is dependent on has finished running.
- Submission time - The colours denote recent (white), older (yellow), and oldest (red) jobs. Jobs with a red submission time field deserve a closer look, as they sometimes indicate an unnecessarily specific resource request.
- Cores - The number of cores requested by your job. You should always
ensure that your job is able to fully utilise exactly the number of cores
specified. Opening an ssh session to a node running your job, and running the
topcommand, to check 100% cpu utilisation per process is a good start. - Array - If the job is an array task, then show the number of remaining tasks, and the step size.
- Extras - This field shows additional options supplied to the job, such as the parallel environment (smp or parallel), total memory requested for the job, and if any resource quotas are being enforced.
To avoid monopolisation by a single user, we apply resource quotas to put a maximum limit on the number of cores used by a user's running jobs, and other quotas such as the number of GPU at one time. The quotas are quite generous, and most users don't hit them. There is also a limit of 100 queued jobs, to encourage use of arrays, which only count as one job.
Assessing queue wait
We're going to now run showqueue -F -e maintuser | grep -v parallel and
examine the jobs in the queue, and get an idea of queue wait times for
different job types:
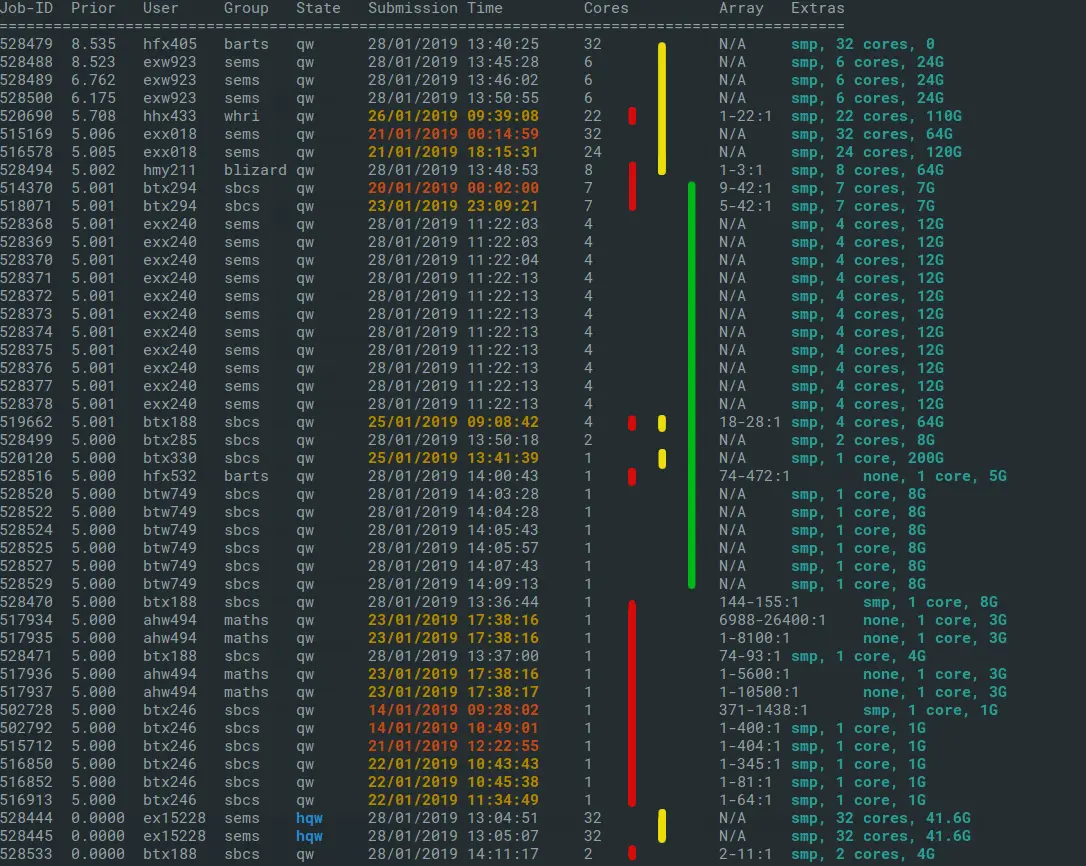
Fig 1: showqueue run at 28/01/2019 at 14:15. Note that output may vary as we regularly make modifications for clarity.
The output has been annotated with the following sections:
- Yellow: jobs requesting significant memory resources and are likely to be waiting a week or more.
- Red: array jobs: note that an array job has many tasks, but the same priority and job id.
- Green : typical churn area of jobs with low waiting time.
A larger job array might look as if it is waiting a long time, but many constituent tasks will have already run. For example, job 517934 in the above output was submitted 5 days ago, but has already run 6987 tasks of 1 core, 3GB RAM, out of 26400 tasks. If you can divide your work into low-resource array tasks, they are a very efficient way to get work done on the cluster.
Note that sometimes you will see a job with priority 0.0000. Typically these
are held jobs, a job array which has a task
concurrency that
has reached its concurrency quota, or jobs in Eqw state.
Finding the churn
In this exercise we are looking for the ideal size for low queuing time, based
upon showqueue output. Excluding the larger memory jobs marked in yellow is a
good start, then inspecting the rest of the jobs for size and age. In the above
example, the block marked in green lines is the most rapid area of change, and
sizing your jobs to fit in this zone will likely result in a low queuing
time.
- It seems that the arrays of 7-core, 7GB jobs are progressing at a rate of about 1 a day.
- There's a block of 4-core, 12GB jobs, that weren't submitted as
an array, and around 5 of them are getting to run each day. You can always
check how many jobs a particular user has in queued and running state with
the command
qstat -u <username>. - The next batch of jobs are a mixture of 1-4 core jobs, of around 8GB RAM. Looking at the age of these jobs, we can estimate a minimum waiting time for jobs of this size. Most of them were submitted today, so it looks most jobs of 1-4 cores, 8GB RAM are starting to run within a few hours
- The big array jobs (comprising many tasks of low resource) at the bottom of the queue (down to the blue bar) will sit at the bottom of the queue steadily mopping up any spare cores that aren't picked up by the jobs above them in the list.
Returning a couple of hours later, the queue looks a bit different, and as we expected, the original block between the green lines has changed completely as most of the jobs have starting running. Some jobs from the top section have run, and remaining ones have bubbled to the top. The large array jobs are still there at the bottom, but have most have had a chunk of jobs processed as they are attempted to run in priority order.
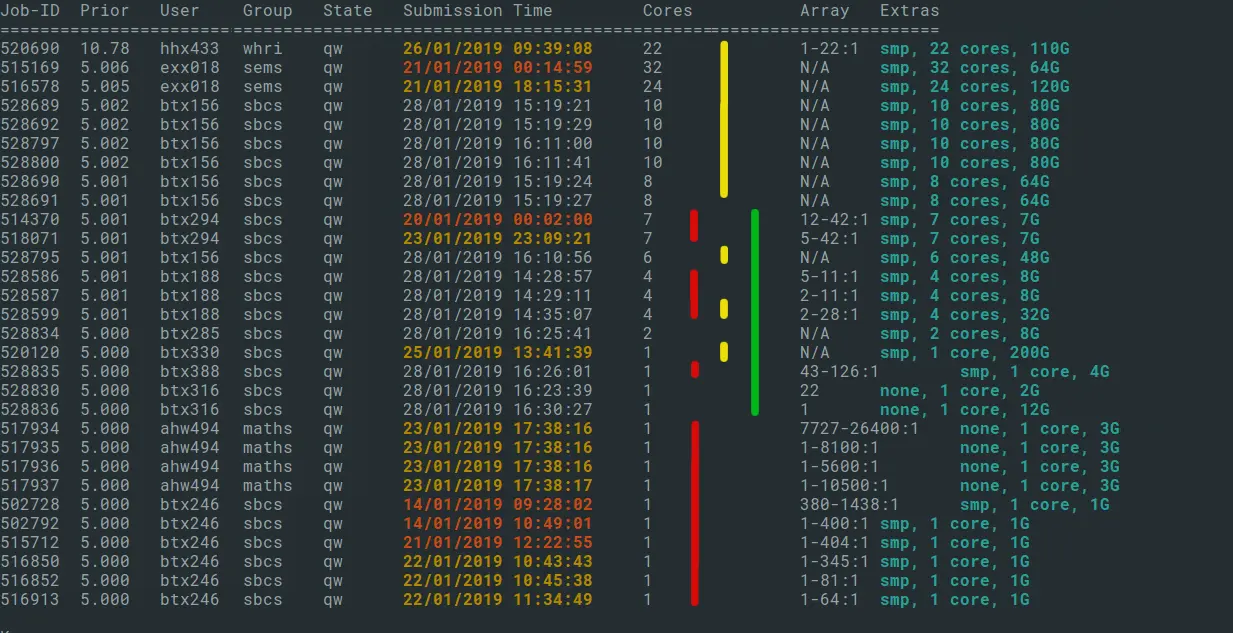
Fig 2: output of showqueue, 2 hours later.
Things to remember:
- If you are submitting jobs that are identical to ones already in the queue, the ones which have waited longest will run first. Viewing the submission time of waiting and running jobs will give you an idea of the wait time for an identical job.
- Submitting a slightly smaller job than the batch of waiting jobs may allow you to leapfrog them.
- Look for the high churn area, usually the middle third of the list, where jobs are going through more rapidly, and try to size your jobs no larger than this if possible. In the example we have looked at, jobs of 1-4 cores, and up to 8GB were running quickly. Depending on the current batch of jobs finishing, this can change over time.
- Bear in mind the hardware specs. Whatever job size you ask for requires a resource-shaped hole to be available on a node. Asking for 10 cores usually needs a similar sized job to finish, or several smaller nodes to finish at once. A smaller resource request will give you a wide scope of nodes to run on.
- Jobs requesting exclusive nodes, or the equivalent resource of a full node, can be queued for a long time when there are many small jobs on the cluster.
Title image: Isaac Smith on Unsplash