Pythonic Parallel Processing for HPC: Your Gauss is as good as mine

There are many strategies and tools for improving the performance of Python code, for a comprehensive treatment see High Performance Python by Gorelick and Ozsvald (institutional access is available to QM staff). However, there are some subtleties when using them in an HPC environment. More bluntly, requesting processor cores does not automatically mean your code will use them effectively, and that cannot happen if it doesn't know how many of them there are!
The Problem
Let us start a qlogin
session with four cores, and investigate the
multiprocessing
module from the Python standard library and the third-party
numba package. Having
logged in to Apocrita:
qlogin -pe smp 4
module load python
Loading the Apocrita Python module will produce the response:
Variable OMP_NUM_THREADS has been set to 4
Now, we shall start a Python virtualenv,
activate it and install some packages:
mkdir gauss_map
python3 -m venv gauss_map/
cd gauss_map/
source ./bin/activate
pip install ipython numpy pillow numba
ipython
The ipython shell has many
useful features, including tab completion, but we are using it for reasons
that will become apparent later on. Let's see how many cores the
multiprocessing
module thinks we have:
In [1]: import multiprocessing

In [2]: multiprocessing.cpu_count()
Out[2]: 48
We clearly don't have access to all 48 cores on the
ddy node, only 4.
(Try os.cpu_count(),
it'll get it wrong too.) Trying to start more processes than we have cores
isn't just pointless, it's actively harmful! Starting each extra process is a
wasteful overhead, as is switching between them. It can even stop further jobs
from being scheduled on a node until the thread:core ratio is normalised. How
does numba fare?
In [3]: import numba

In [4]: numba.get_num_threads()
Out[4]: 4
That's better. We should never naively call
multiprocessing.Pool()
on the cluster. Instead, we might explicitly specify the number of cores with:
import os
import multiprocessing

pool = multiprocessing.Pool(int(os.environ.get('OMP_NUM_THREADS',
    multiprocessing.cpu_count())))
The OMP_NUM_THREADS environment variable will be set to the string '4', so
we must cast it to an int. If it's not set, it can default to
multiprocessing.cpu_count()
so our code can be portable outside the cluster.
This is already quite a strong moral to our story, but let us explore a more
concrete and hopefully amusing example and see what
multiprocessing
and numba can do for us.
The Gauss Map
The Gauss Map is a chaotic attractor described by the recurrence relation:
To produce bifurcation diagrams, we:
- Choose a value of \(\alpha\).
- Scan \(\beta\) from a minimum to a maximum value along the x-axis.
- For each \(\beta\), initialise \(x_{0}\) to 0.
- Iterate the recurrence relation a few times to get rid of transients.
- Iterate again, plotting the intensity of the histogram of the values as a column of points.
We could implement this in Python as:
from itertools import islice
from functools import partial

import numpy as np
from PIL import Image

def gauss_map(alpha, beta):
    x = 0.0
    while True:
        x = np.exp(-alpha * x**2) + beta
        yield x

def gauss_slice(beta, alpha, bins=400, skip=200, points=2000):
    gauss = np.fromiter(islice(gauss_map(alpha, beta), skip, skip+points),
        dtype=np.float32)
    hist, _ = np.histogram(gauss, bins=bins, range=(-1.0, 1.5))
    return hist[::-1] / points

def gauss_scan(alpha, beta_min=-1.0, beta_max=1.0, width=640, height=400):
    slicer = partial(gauss_slice, alpha=alpha, bins=height, points=10*height)
    return np.stack([slicer(beta)
        for beta in np.linspace(beta_min, beta_max, width)])

def gauss_image(alpha, width=640, height=400):
    im = 1.0 - np.sqrt(gauss_scan(alpha, width=width, height=height))
    return Image.fromarray((255 * im.T).astype(np.uint8))
- The
gauss_mapfunction returns a Python generator, whichyields a series of values. - In
gauss_slice, we discard the firstskipvalues usingitertools.islice. - We turn the remaining points we want into a
numpyarray withnp.fromiter. - The intensities of the points to plot are found with
np.histogram. - As the origin of a bitmap image is top-left, we reverse the histogram with
[::-1]and normalise it. - In
gauss_scan, we hold all the parameters ofgauss_sliceconstant inslicerexcept forbetawithfunctools.partial. - We use a
list-comprehension
to build a sequence of columns, applying
slicerto values ofbetafromnp.linspace. - We turn the columns into a 2d array with
np.stack. - Finally, we turn the array into an image with the
Pillow package in
gauss_image. - The normalised image is made more dramatic by reducing its dynamic range
with
np.sqrt. Image.fromarrayworks by scaling the array to 255 and casting it to unsigned 8-bitints, (np.uint8).
Test the code with:
gauss_image(alpha=5.8).save('gauss_map.png')
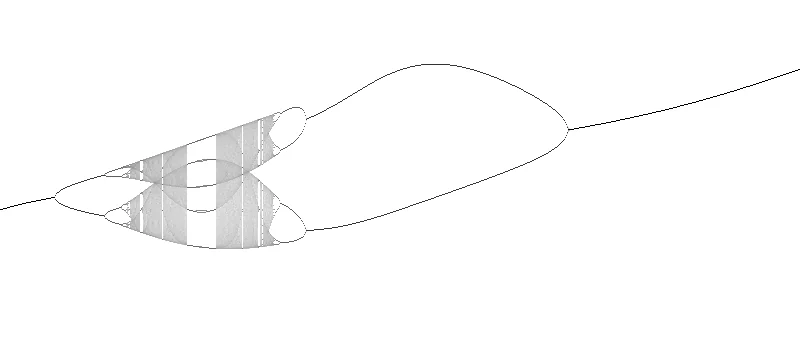 Gauss Map bifurcation diagram
We can see how well it performs with
ipython's
%timeit magic command:
%timeit gauss_image(alpha=5.8)
2.59 s ± 44.9 ms per loop (mean ± std. dev. of 7 runs, 1 loop each)
That's nearly 3s for a mere 640 x 400 image, we're not using all the cores we
asked for. Can we do better? Before we just throw cores at the problem, we
should try to understand why the code was slow. One should never try to
optimise code without profiling it first, it just wastes time solving problems
that might not really be there. Fortunately, there are many ways to profile
Python code, including the
cProfile module from the
standard library. Here, we use it to run the code, save the profile information
to a file, then sort it by the cumulative time spent in each function:
import cProfile
import pstats
from pstats import SortKey

cProfile.run('gauss_image(alpha=5.8)', 'single_threaded_gauss')
single_threaded_stats = pstats.Stats('single_threaded_gauss')
single_threaded_stats.sort_stats(SortKey.CUMULATIVE).print_stats(10)
We can see that the code spends about 80% of the time doing what it should;
iterating the gauss_map function, there's not much fat to trim from the
ancillary code around it:
         2733504 function calls (2728381 primitive calls) in 2.956 seconds

   Ordered by: cumulative time
   List reduced from 64 to 10 due to restriction <10>

   ncalls  tottime  percall  cumtime  percall filename:lineno(function)
        1    0.000    0.000    2.956    2.956 {built-in method builtins.exec}
        1    0.000    0.000    2.956    2.956 <string>:1(<module>)
        1    0.001    0.001    2.956    2.956 <ipython-input-1-adb271d30f9d>:22(gauss_image)
        1    0.000    0.000    2.954    2.954 <ipython-input-1-adb271d30f9d>:18(gauss_scan)
        1    0.001    0.001    2.953    2.953 <ipython-input-1-adb271d30f9d>:20(<listcomp>)
      640    0.004    0.000    2.952    0.005 <ipython-input-1-adb271d30f9d>:13(gauss_slice)
      640    0.462    0.001    2.869    0.004 {built-in method numpy.fromiter}
  2688640    2.406    0.000    2.406    0.000 <ipython-input-1-adb271d30f9d>:7(gauss_map)
 5765/642    0.013    0.000    0.080    0.000 {built-in method numpy.core._multiarray_umath.implement_array_function}
      640    0.000    0.000    0.079    0.000 <__array_function__ internals>:177(histogram)
Doing a bit better with Multiprocessing
Each column in the bifurcation diagram can be calculated independently for its
own value of \(\beta\). Splitting this work across multiple processes should
help. There's no inter-process communication required except waiting for them
all to finish. We might say it's
embarrassingly parallel.
To use multiprocessing, import Pool from it and update the gauss_scan
function:
import os
from multiprocessing import cpu_count, Pool

def gauss_scan(alpha, beta_min=-1.0, beta_max=1.0, width=640, height=400):
    slicer = partial(gauss_slice, alpha=alpha, bins=height, points=10*height)
    scan_pool = Pool(int(os.environ.get('OMP_NUM_THREADS', cpu_count())))
    return np.stack(list(scan_pool.map(slicer,
        np.linspace(beta_min, beta_max, width))))
- Initialise a
Poolwith the Appropriate Number Of Cores. - Use the pool to
map
the
slicerfunction to thelinspaceofbetavalues. - Numpy can
stackthe resulting columns if we put them in alist.
How did we do this time?
933 ms ± 338 ms per loop (mean ± std. dev. of 7 runs, 1 loop each)
That's an improvement of nearly a factor of three! Surely we are upstanding members of the Apocrita community, making full use of the resources we requested. Or are we?!
Doing (arguably) a lot better with Numba
Numba is a just-in-time (JIT) compiler for
Python, that also supports parallelization. It's particularly good for
accelerating loops and numpy functions. In theory,
all we have to do is apply a decorator to our functions. In practice,
numba complains bitterly about most of our
existing code, it needs significant modifications to work. For the
best speed increases,
we need to use the @njit decorator in
nopython mode.
This puts some limits on the Python features we can use. Our example might end
up a bit like:
from numba import njit, prange

@njit
def gauss_map(x, alpha, beta):
    return np.exp(-alpha * x**2) + beta

@njit
def gauss_slice(beta, alpha, bins=400, skip=200, points=2000):
    x = 0.0
    for _ in range(skip):
        x = gauss_map(x, alpha, beta)

    gauss_points = np.zeros(points, dtype=np.float32)
    for i in range(points):
        x = gauss_map(x, alpha, beta)
        gauss_points[i] = x
    hist, _ = np.histogram(gauss_points, bins=bins, range=(-1.0, 1.5))
    return hist[::-1] / points

@njit
def gauss_scan(alpha, beta_min=-1.0, beta_max=1.0, width=640, height=400):
    points = 10 * height
    img = np.zeros((width, height), dtype=np.float32)
    for i, beta in enumerate(np.linspace(beta_min, beta_max, width)):
        img[i, :] = gauss_slice(beta, alpha, bins=height, points=points)
    return img
gauss_mapis no longer a generator, it's a regular function.- We no longer skip the transients with
isliceingauss_slice, we perform the iterations in separateforloops. - We pre-allocate each column with
np.zeros, and index the arrays with a loop-counter. - Similarly, we pre-allocate the 2d array in
gauss_scan, and build it up column by column.
What did we get for our trouble?
91.1 ms ± 90.7 µs per loop (mean ± std. dev. of 7 runs, 1 loop each)
That's more than a factor of ten compared to our multiprocessing example,
and nearly a factor of thirty compared to our original single-threaded code.
However, our numba code is single-threaded;
we haven't tried to parallelize it yet. Fast single-threaded code can be
better than merely throwing cores at the problem. (It is left as an exercise
to the reader to verify that removing the decorators reverts performance to
that of the original code.) This time, using @njit(parallel=True) causes
numba to complain that it has nothing to do.
gauss_scan has to change again:
@njit(parallel=True)
def gauss_scan(alpha, beta_min=-1.0, beta_max=1.0, width=640, height=400):
    points = 10 * height
    img = np.zeros((width, height), dtype=np.float32)
    beta = np.linspace(beta_min, beta_max, width)
    for i in prange(width):
        img[i, :] = gauss_slice(beta[i], alpha, bins=height, points=points)
    return img
We need to tell numba that a loop can be
parallelized explicitly with its
prange function.
-No more iterating over each value of beta and its index with
enumerate we
have to refer to each value and the corresponding column in the img array
with a loop-counter.
What's the "final" score?
26.6 ms ± 3.23 ms per loop (mean ± std. dev. of 7 runs, 1 loop each)
That's more than a factor of three improvement over single-threaded numba,
and a huge factor of thirty-five over multiprocessing for the same number
of cores. Is numba better than
multiprocessing?
Not necessarily...
- We've had to do quite a bit of work to make our code palatable to
numba, it's become more procedural and verbose. - Everyone else in the code-base must learn to do things
numba's way. We need to factor in how long it takes to write code as well as how long it takes to run. - The more Pythonic features we've had to abandon like
itertoolsandfunctoolsmight help us in areas wherenumbamight not, such as disk-IO performance and RAM usage. - We've added an extra dependency, which might create friction for others
adopting our code. (
numbasubmight help here.)
A Compromise?
We've achieved a huge reduction in run-time by re-writing nearly all our code
for numba, but at the cost of several Pythonic
features we might want to keep. Recall that most of the time was spent in the
gauss_map function. Let's restore all the original single-threaded code, but
add the @njit decorator to the generator version of gauss_map.
numba doesn't mind doing this, it's the other
functions that make it complain, so we shan't use it with them:
@njit
def gauss_map(alpha, beta):
    x = 0.0
    while True:
        x = np.exp(-alpha * x**2) + beta
        yield x
We get a healthy near factor of ten improvement over the original
single-threaded code, even though the best single-threaded all-numba
result was three times faster:
279 ms ± 4.6 ms per loop (mean ± std. dev. of 7 runs, 1 loop each)
We might as well restore the version of gauss_scan that uses
multiprocessing:
121 ms ± 2.76 ms per loop (mean ± std. dev. of 7 runs, 10 loops each)
This is a little over twice as fast; the overhead of starting processes is
really starting to bite now that gauss_map is so fast. The best parallel
all-numba result is still faster by a factor of four. However, modifying our
original code by adding a single @njit decorator and one
multiprocessing.Pool was quick, easy, and arguably readable. I declare
multiprocessing and numba the winner.
Final Thoughts
- Seriously, don't call
multiprocessing.Pool()without any arguments on the cluster. It Won't Help. - Optimising code is tricky, but rewarding and worth it, so don't waste your efforts by not profiling first.
- Spare a thought for those who will read your code; it's probably you in a fortnight anyway.