Intel Inspector 2022.2 on Apocrita

As the complexity of HPC applications increases, the management of memory and threading scopes becomes increasingly important. Tools like Intel Inspector are crucial in this context, to effectively identify and resolve a wide array of memory errors and thread synchronisation issues.
Introduction
Intel Inspector is a dynamic analysis tool designed to detect and debug memory and threading errors in high-performance computing (HPC) applications. Commonly used with C, C++, and Fortran code, it helps developers identify and resolve issues that can impact performance and reliability. The tool offers both a command-line interface (CLI) for easy scripting and automation, and a graphical user interface (GUI) for a more interactive exploration and analysis of issues.
Accessing Intel Inspector on Apocrita
Intel Inspector is included in the Intel oneAPI suite with a variety of other tools. To access it on Apocrita, simply load the modules in order:
module load intel/2022.2 inspector
Optionally, you can install the Inspector GUI client on your local
machine, either as a standalone version or within the
HPC Toolkit version. Note that due to ssh tunnel
limitations, the GUI will only access Apocrita's frontend for result
visualisation. More details can be found in
the Appendix section.
Setting up the code for Inspector
To obtain accurate results and minimise erroneous reporting, compile your code with specific flags for Intel Inspector. This means enabling debug information, disabling optimizations, and omitting runtime checks. For threading analysis, ensure your code creates and uses more than one thread.
| Languages | Required Flags | will cause Errors |
|---|---|---|
| C/C++ | -g -O0 -backtrace -shared-intel |
-fmudflap |
| Fortran | -g -O0 -backtrace -shared-intel -check:none |
-check all |
| OpenMP | -qopenmp |
Running Intel Inspector with gcc
While this post focuses on using Intel Inspector with intel compilers,
it's possible to use it with gcc compilers. This process can be more
complex and may require additional configuration. For assistance, contact
the RSE team to help you use Inspector effectively with your code.
Choosing an Inspector analysis
Before running an analysis with Intel Inspector, it's important to know the types of analyses and their scope levels. Inspector offers two types of analysis: memory leak error and threading error. Each type has three scope levels: narrow, medium, and wide.
Narrow scope is fast and resource-efficient but may miss some issues. Wide scope is thorough but slower and more resource-intensive. Medium scope balances speed and thoroughness. The scopes are named as follows:
| Memory error analysis | name | scope |
|---|---|---|
| Detect Leaks | mi1 | narrow |
| Detect Memory Problems | mi2 | medium |
| Locate Memory Problems | mi3 | wide |
| Threading error analysis | ||
| Detect Deadlocks | ti1 | narrow |
| Detect Deadlocks and Data Races | ti2 | medium |
| Locate Deadlocks and Data Races | ti3 | wide |
Some tips for choosing the correct type:
- Use analysis types iteratively, starting with the narrow scope to verify a good setup of both the program and Inspector, while setting expectations for the analysis duration.
- Estimated collection time may be 2 to 320 times longer than the normal execution time.
- Data set size and workload have a direct impact on application execution time and analysis speed.
Comparing methods for running Inspector
There are three methods to run an analysis: via qlogin, a
job script, or the Open OnDemand interface. Each has its advantages
and limitations, depending on factors such as available resources,
urgency, analysis duration, and result visualisation preference.
| Method | Advantages | Limitations | Results |
|---|---|---|---|
qlogin |
Quick and easy to set up, ideal for simple analyses | Limited access to resources | Command line summary or through the local GUI client |
| Job script | Queues normally and runs when resources are available, good for longer or more resource-intensive analyses | Script requires additions, has to go through queue | Command line summary or through the local GUI client |
| Open OnDemand | Runs on a compute node with full GUI capabilities, ideal for complex analyses. Quick and easy to setup | Limited access to resources, has to go through queue | GUI client-based |
qlogin and Open OnDemand are quick and easy to set up but may have
limited resources. Job scripts queue normally and run when resources
are available. Result visualisation options vary based on the method.
Note that the local GUI client can only ssh to the frontend, limiting
its functionality for analysing results. Running projects or analyses
from the GUI on the frontend should be avoided. In contrast, Open
OnDemand provides full GUI capabilities for running analyses and
visualising results.
Setting up environment variables for an analysis
When running an Intel Inspector analysis, you need to set up the
required environment variables. We consider two sets of
variables: a general set, and a specific set for the qlogin and
job script cases. To include these variables, execute the following
commands on the command line or add them to your job script,
adjusting the paths as needed.
General set
module load intel/2022.2 inspector # load the modules in order
ulimit -s unlimited                # no stack size limit on the OS side
export OMP_NUM_THREADS=${NSLOTS}   # number of OpenMP threads
export OMP_STACK_SIZE=512M         # size of stack size for OpenMP threads
Specific set
export SRCA=/data/home/user/path/to/source/dir/
export SRCB=/data/home/user/path/to/objects/dir/
export SRCC=/data/home/user/path/to/binary/dir/
Program analysis and viewing results
We've covered choosing a method for running Inspector, selecting an analysis type, and setting up the program and environment. In this section, we will run an analysis and manage the generated results.
Running an analysis in an interactive session: qlogin
To run an Intel Inspector analysis using qlogin, follow these steps:
- Start an interactive session with sufficient resources.
- Load the required modules and set your environment.
- Compile your program with the appropriate flags.
- Invoke the Inspector and your program from the command line, ensuring you have enough time for the analysis.
Refer to the naming scheme table in the previous section to select the
correct <analysis>. Then, run the command below for your program:
inspxe-cl -collect <analysis> \
-search-dir src:r=${SRCA} \
-search-dir sym:r=${SRCB} \
-search-dir bin:r=${SRCC} \
-- ${SRCC}/program
Running an analysis in batch mode: job script
To run Inspector in batch mode:
- Create a copy of your job script.
- Pre-compile your program with the appropriate flags.
- Add the required modules and environment variables and program invocation.
- Submit the job using the
qsubcommand.
Ensure you request enough resources, as insufficient resources will cause the job to fail. A sample job script to check for race conditions is available in the Appendix.
Viewing the results on the command line
To view results using the command line, you can run the following commands:
# -R stands for -report, -r for -result-dir - Replace "dir" with the results' directory
inspxe-cl -R status       -r dir/ # brief statement of problems by state
inspxe-cl -R summary      -r dir/ # brief statement of problems by type
inspxe-cl -R problems     -r dir/ # detailed report of detected problems
inspxe-cl -R observations -r dir/ # detailed report of code locations in problem sets
For more information, consult the documentation. You can
use inspxe-cl -help to display all available options or run
inspxe-cl -help <option> to see details for a specific option.
Real-world example
For a real-world example, we used the Multipoint Approximation Method for
Aero-Structural optimisation MAM4AS Fortran code, developed by Yu Zhang, PhD,
Elliot K. Bontoft, PhD, Prof. Vasili Toropov, et al.. We ran Inspector
using the narrow mi3 scope to detect memory access issues. The summary and
status commands produce the following brief statements:
$ inspxe-cl -R summary -r r002mi3
27 new problem(s) found
15 Invalid memory access problem(s) detected
1 Memory leak problem(s) detected
10 Uninitialized memory access problem(s) detected
1 Uninitialized partial memory access problem(s) detected
$ inspxe-cl -R status -r r002mi3
27 problem(s) found
1 Investigated
26 Not investigated
Breakdown by state:
1 Confirmed
26 New
Invoking the tool with problems instead, provides a breakdown of the detected
issues; below is a curated selection of four:
$ inspxe-cl -R problems -r r002mi3
P1: Error: Memory leak: New
 P1.33: Error: Memory leak: 240 Bytes: New
  /data/home/aax010/git/mam4as/linux/../src/MAM4AS_main.f90(81):
  Error X52: Allocation site:
  Function mam4as:
  Module /data/home/aax010/git/mam4as/linux/bin/MAM4AS

P2: Error: Invalid memory access: New
 P2.13: Error: Invalid memory access: New
  /data/home/aax010/git/mam4as/linux/../src/doe/Check_for_existing_points.f90(52):
  Error X16: Read:
  Function mam2_check_for_existing_points:
  Module /data/home/aax010/git/mam4as/linux/bin/MAM4AS

P4: Error: Invalid memory access: New
 P4.6: Error: Invalid memory access: New
  /data/home/aax010/git/mam4as/linux/../src/MAM4AS_main.f90(151):
  Error X7: Read: Function mam4as:
  Module /data/home/aax010/git/mam4as/linux/bin/MAM4AS

P12: Error: Invalid memory access: New
 P12.16: Error: Invalid memory access: New
  /data/home/aax010/git/mam4as/linux/../src/linearSolver/linear_solver.f90(121):
  Error X21: Read: Function mam2_linear_solver:
  Module /data/home/aax010/git/mam4as/linux/bin/MAM4AS
  /data/home/aax010/git/mam4as/linux/../src/linearSolver/linear_solver.f90(56):
  Error X22: Allocation site: Function mam2_linear_solver:
  Module /data/home/aax010/git/mam4as/linux/bin/MAM4AS
The report displays the error type, detection history, and source location. Detailed explanations of error types, examples, and potential fixes can be found on Inspector's website and in the documentation.
Running an analysis in Open OnDemand
Apocrita's OnDemand service is a web-based platform that provides easy access to computing resources, ideal for workloads requiring a graphical component. To perform an analysis using Intel Inspector:
- Launch a session using the "Desktop Environment (CPU)" option. Select appropriate resources.
- Open
xtermto access the terminal on the compute node. - Load the necessary modules and set up the required environment variables.
- Start Inspector by calling
inspxe-guiin the terminal.
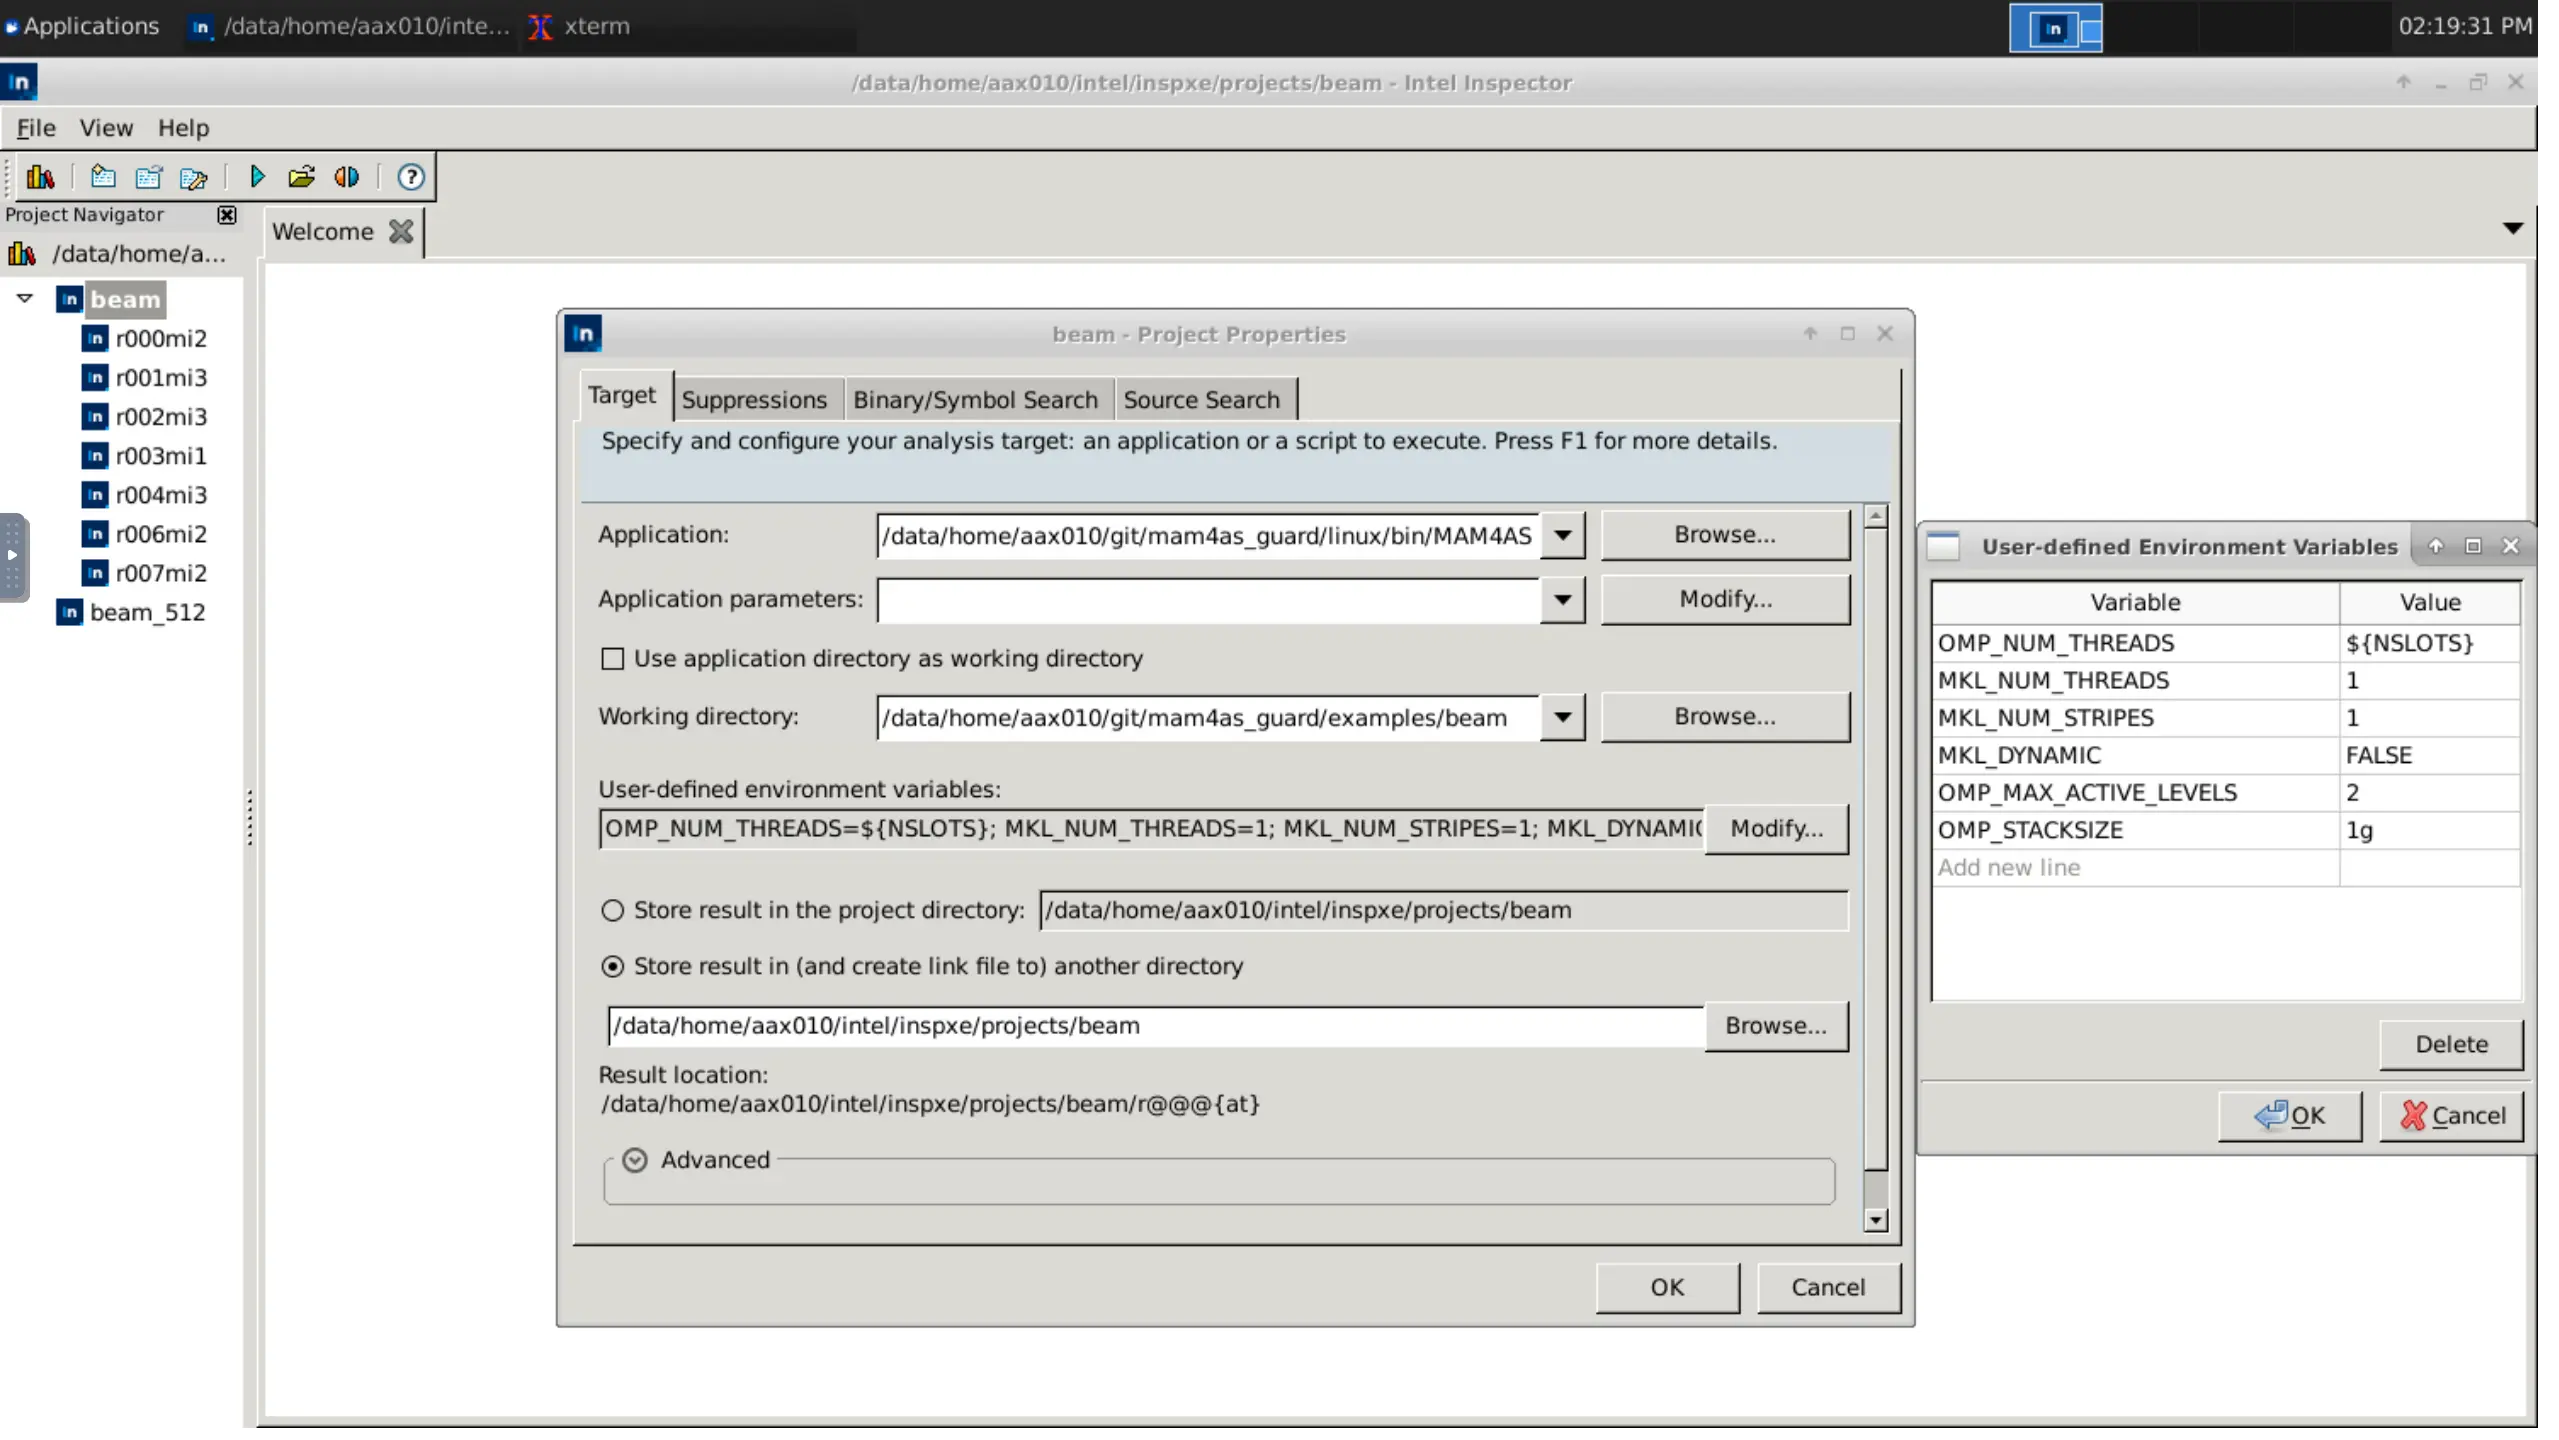
Create a new project to group the results for easier management. Provide details for the program, including the executable name and paths to source, objects, and the executable. Additionally, modify the environment variables as shown, if not already set in the terminal.
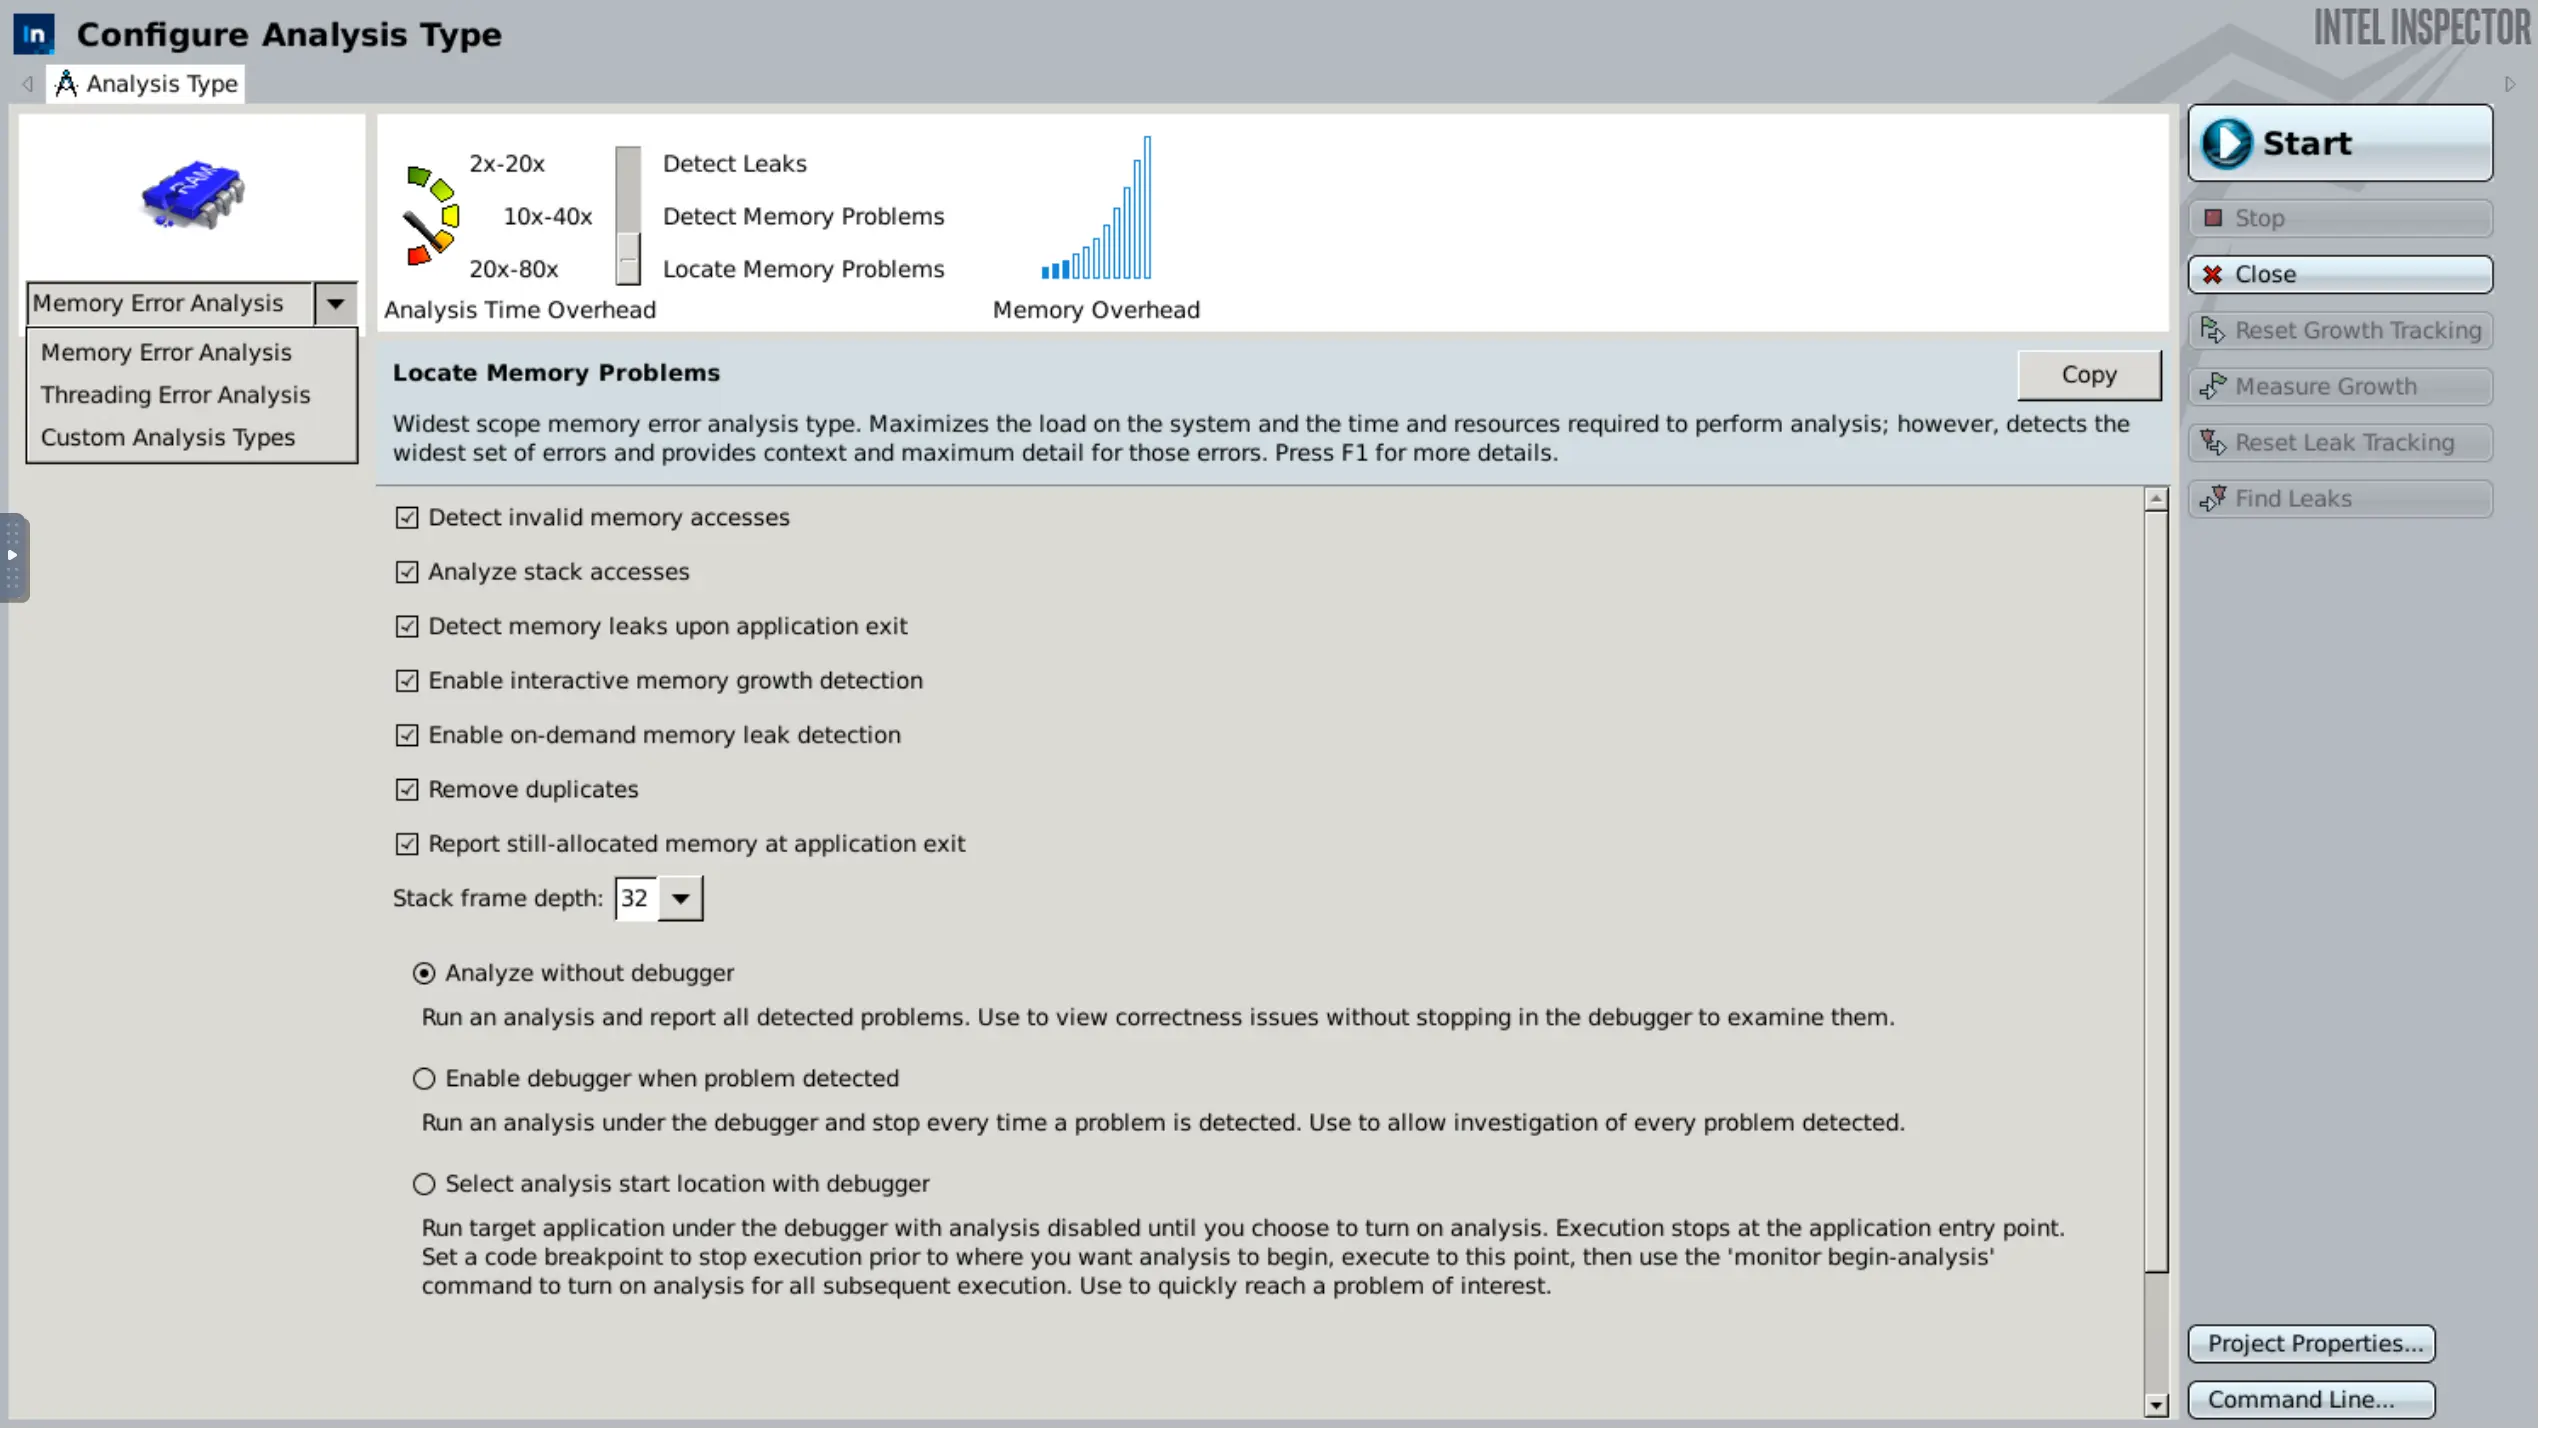
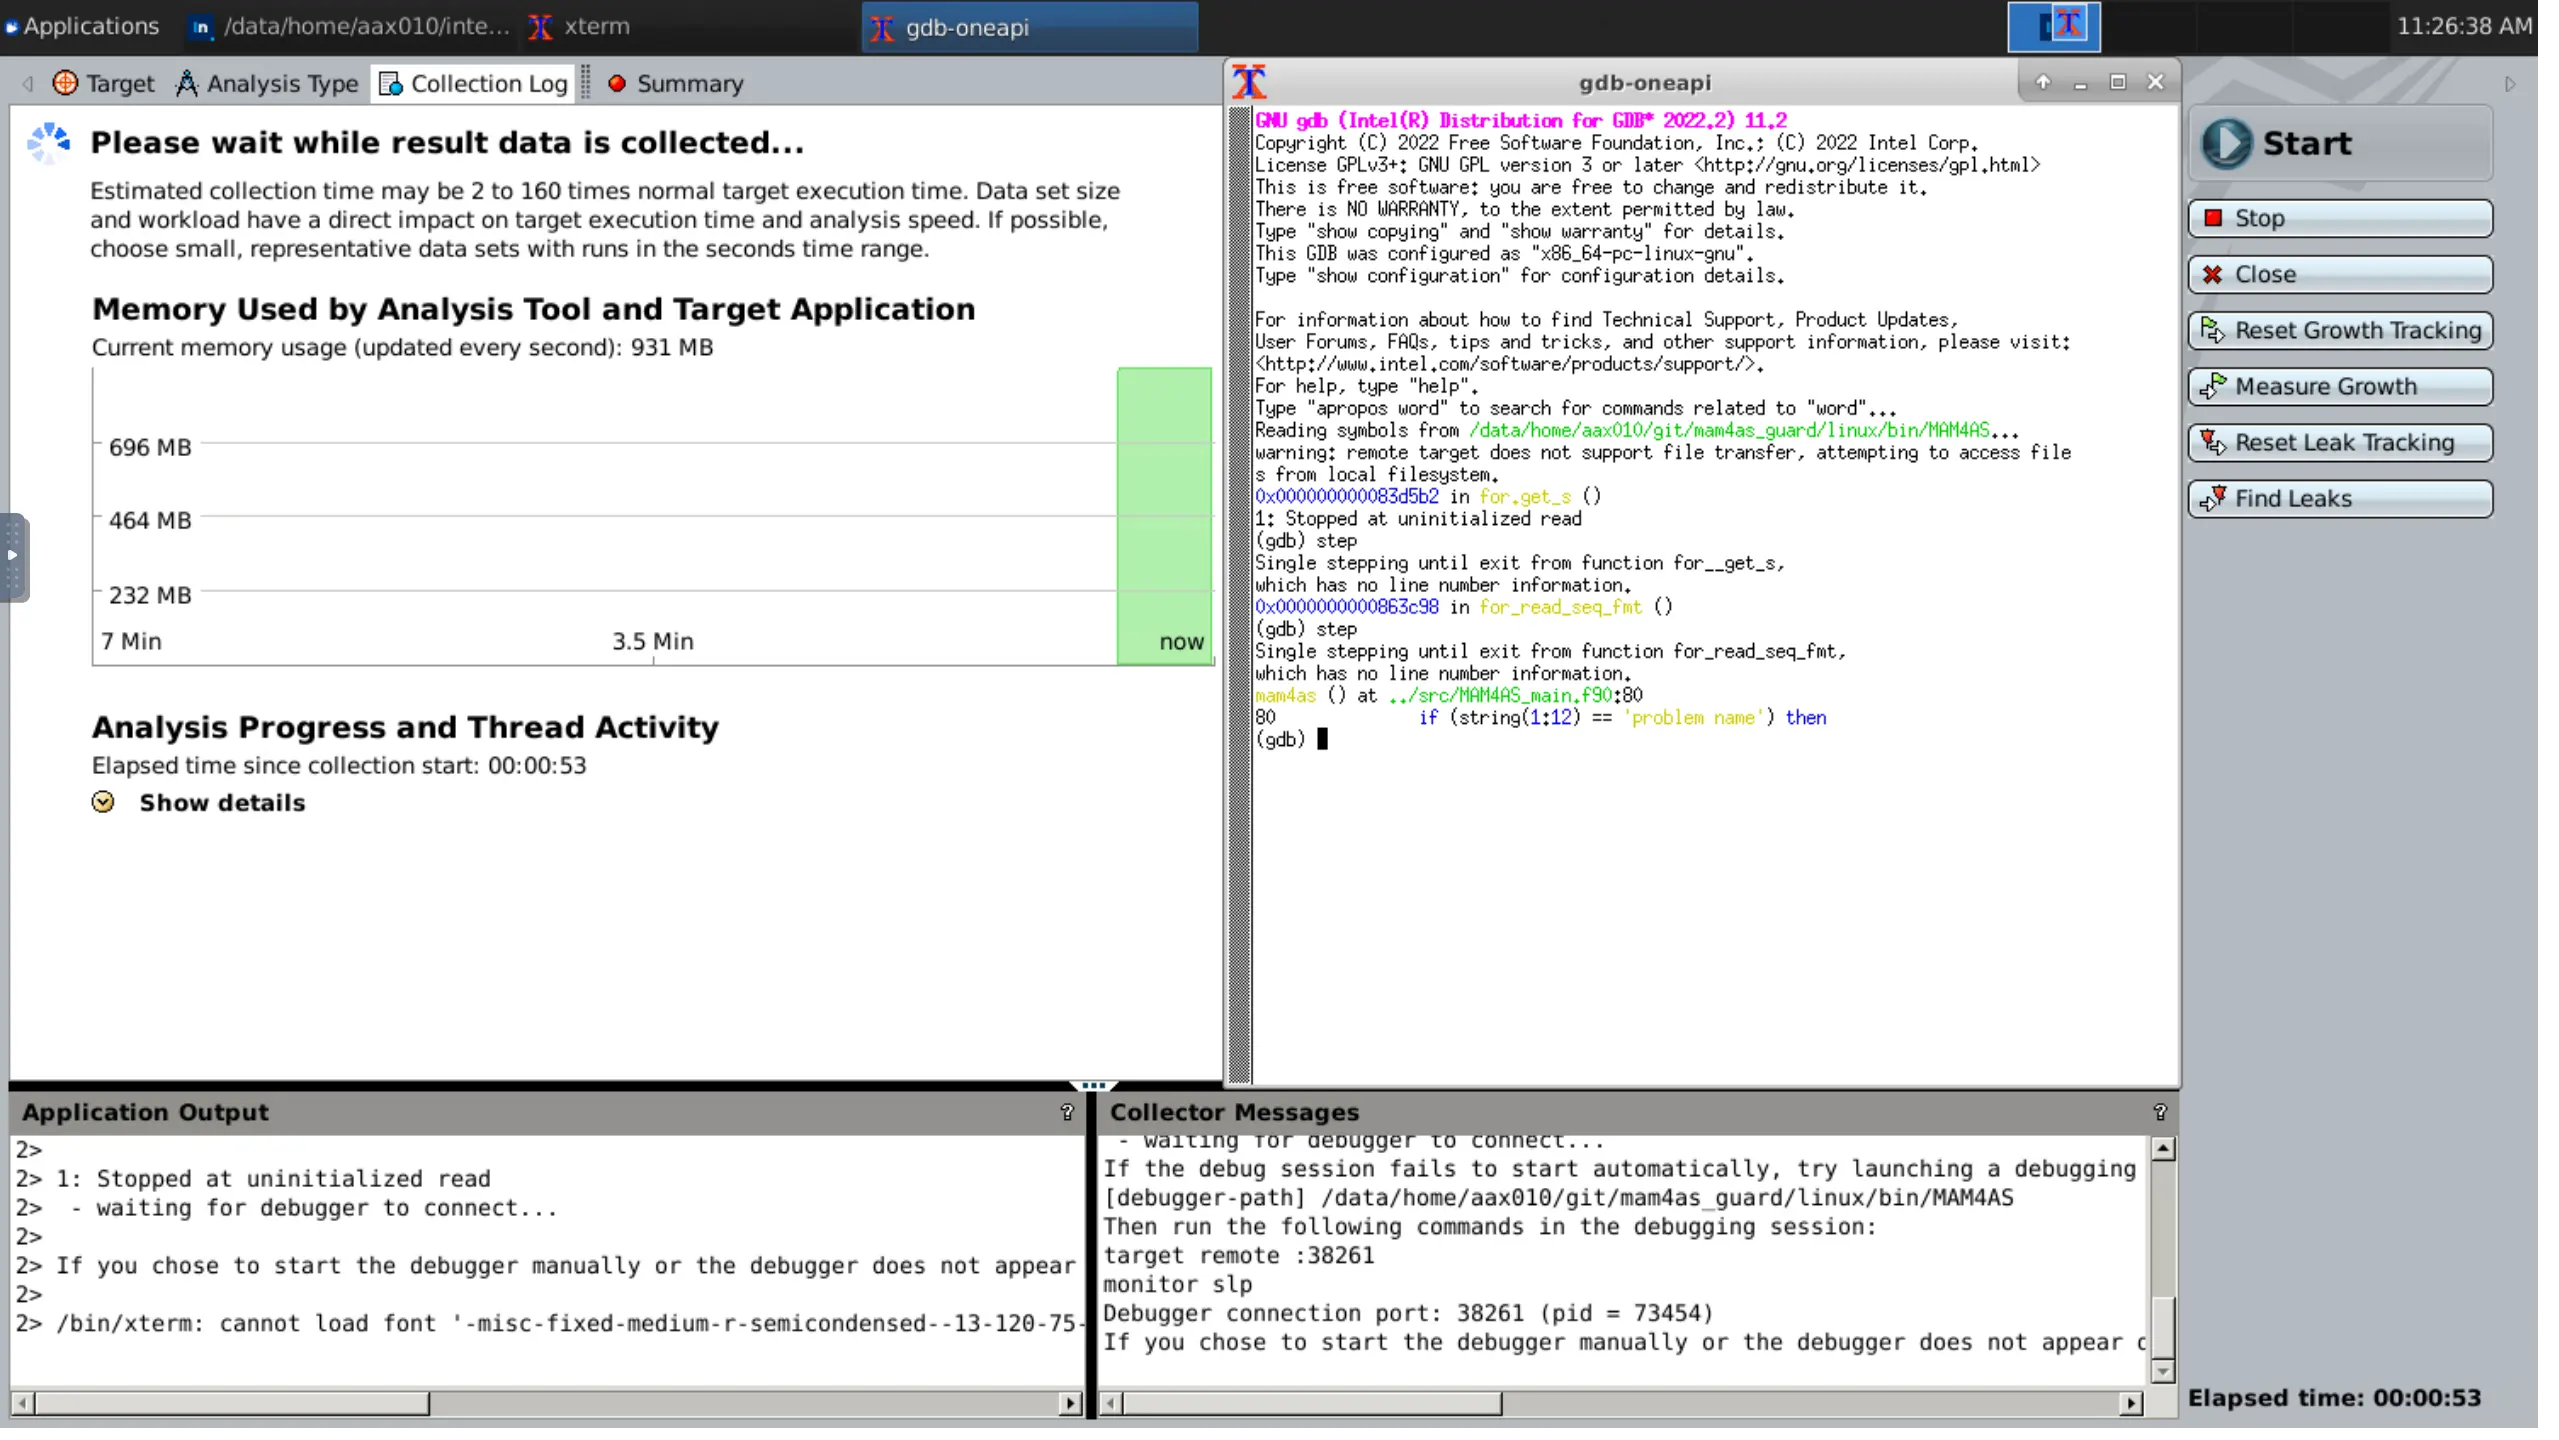
After the setup is completed, we can start a new analysis using the available graphical options. The different analysis types and scopes can be set here, as well as a multitude of other options. If needed, we can introduce custom types too. On the bottom right, there is the option of extracting the actual command prompt; useful to replicate testing with the other two methods.
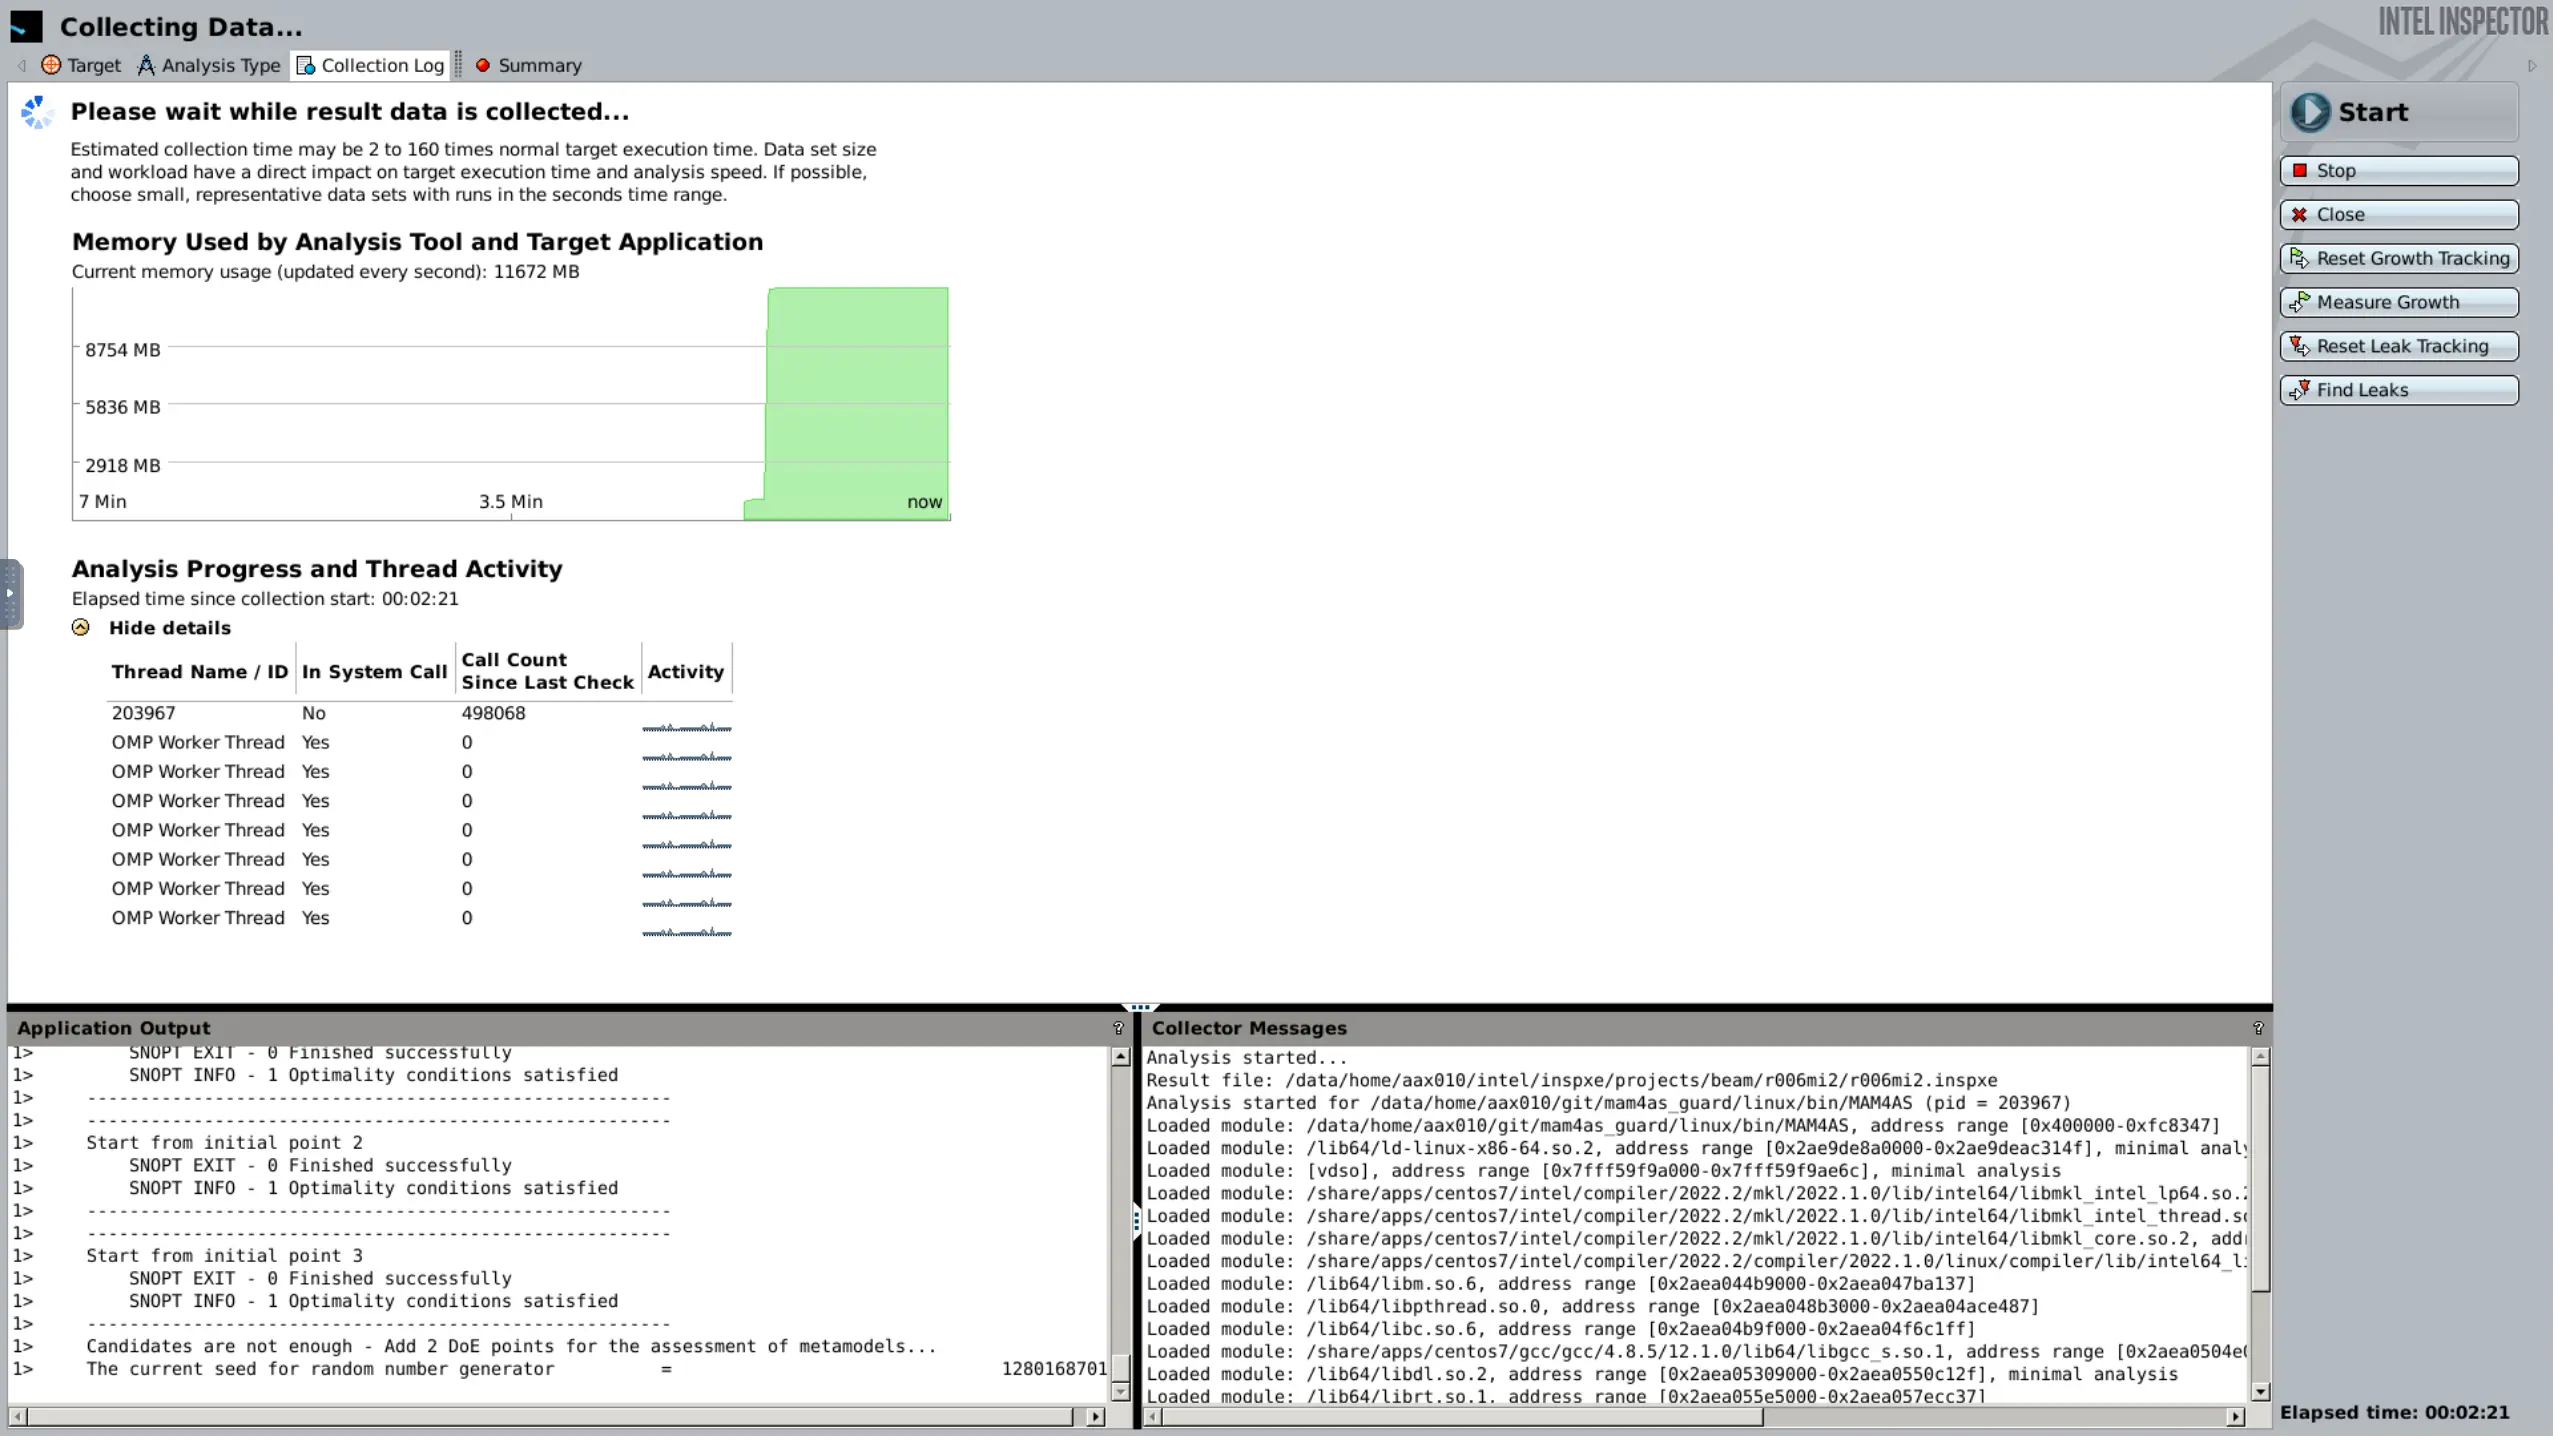
Starting the analysis, the collection of data commences, including memory usage and the use of other threads and processes. Notice the output windows for the program on the left, and Inspector on the right.
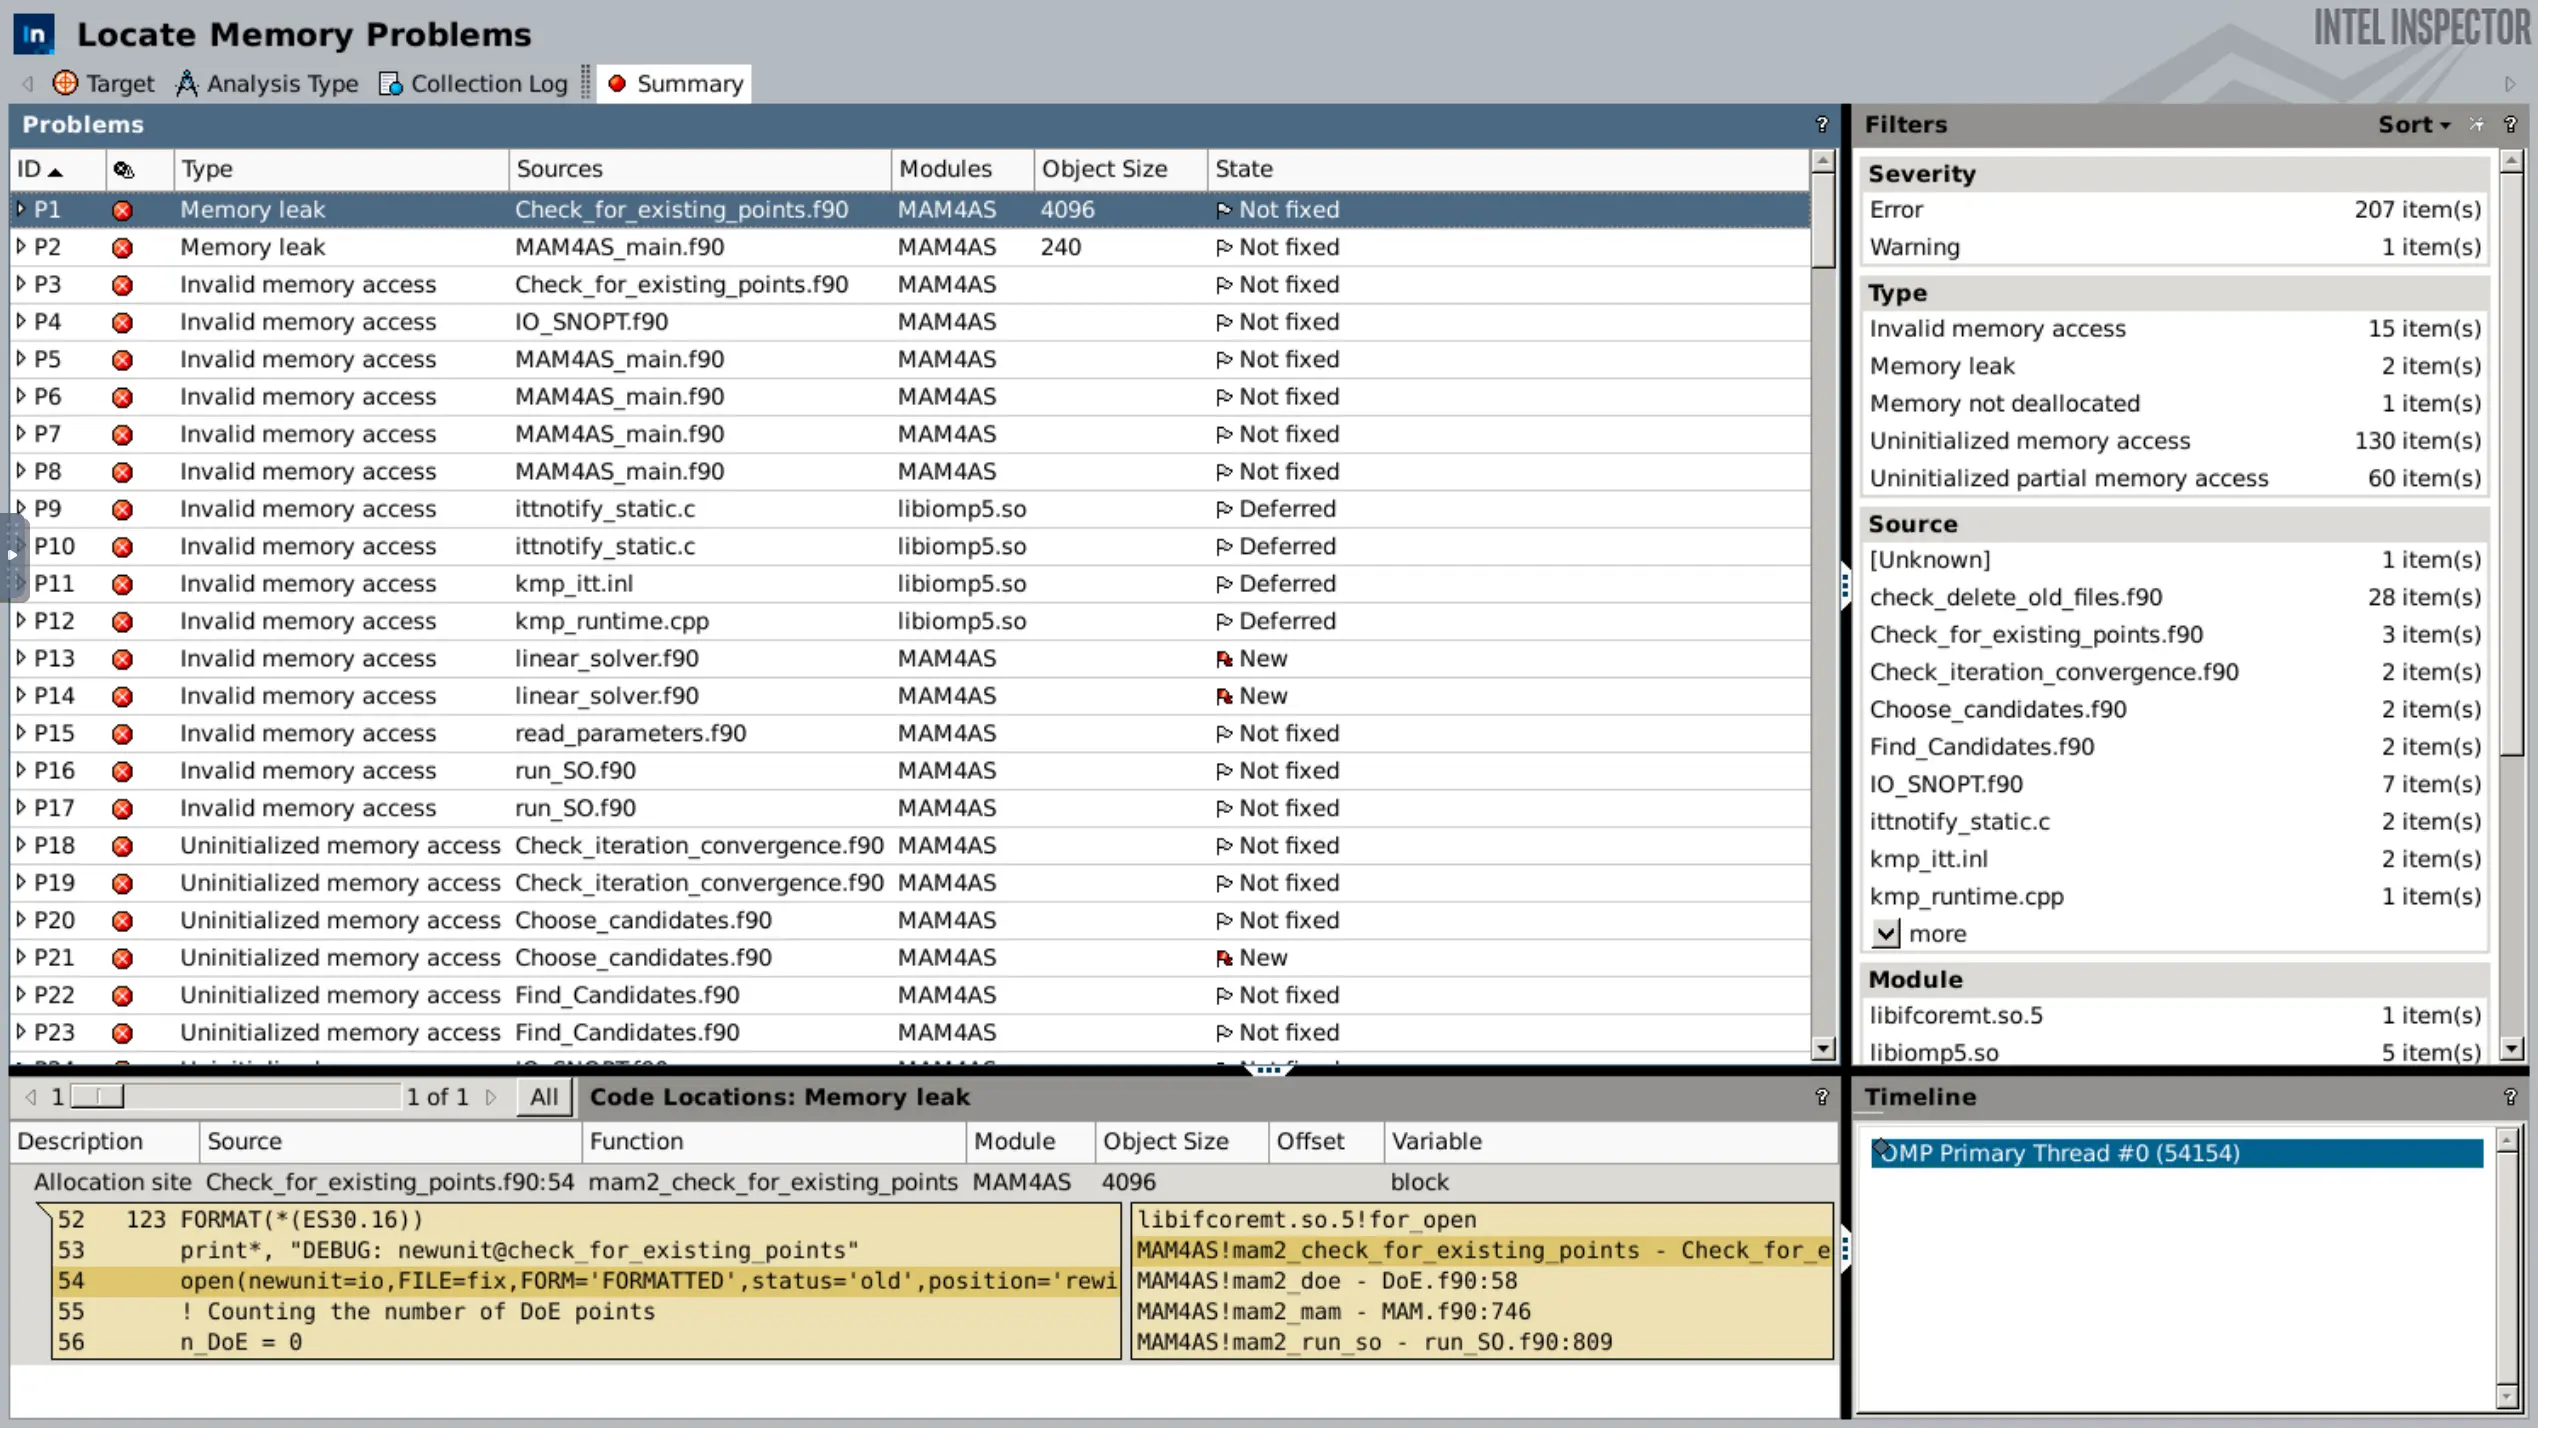
When the collection finishes, it will automatically open the results screen. This screen will provide all information about the detected issues; the types of errors, the source files and lines, the module that generated them, and more. On the bottom, the relevant code snippet from the highlighted issue will appear, as well as the stack image at the time of the error.
Interactive Debugging with Intel Inspector
Setting Up the Debugger
Intel Inspector can pause execution and request a debugger when an issue
is detected. To set up the debugger, choose between the standard gdb
module or Intel's gdb-oneapi debugger module.
For gdb, run module load gdb before opening the GUI. For Intel's
gdb-oneapi, force-load the GCC module and debugger:
module load debugger      # findable once intel/2022.2 is loaded
module load -f gcc/12.1.0 # library dependencies for gdb-oneapi
In the Inspector GUI, select the preferred debugger at "File" ->
"Options" -> "Debugger". Provide the Intel gdb-oneapi path, if needed.
/share/apps/centos7/intel/compiler/2022.2/debugger/2021.6.0/gdb/intel64/bin/gdb-oneapi
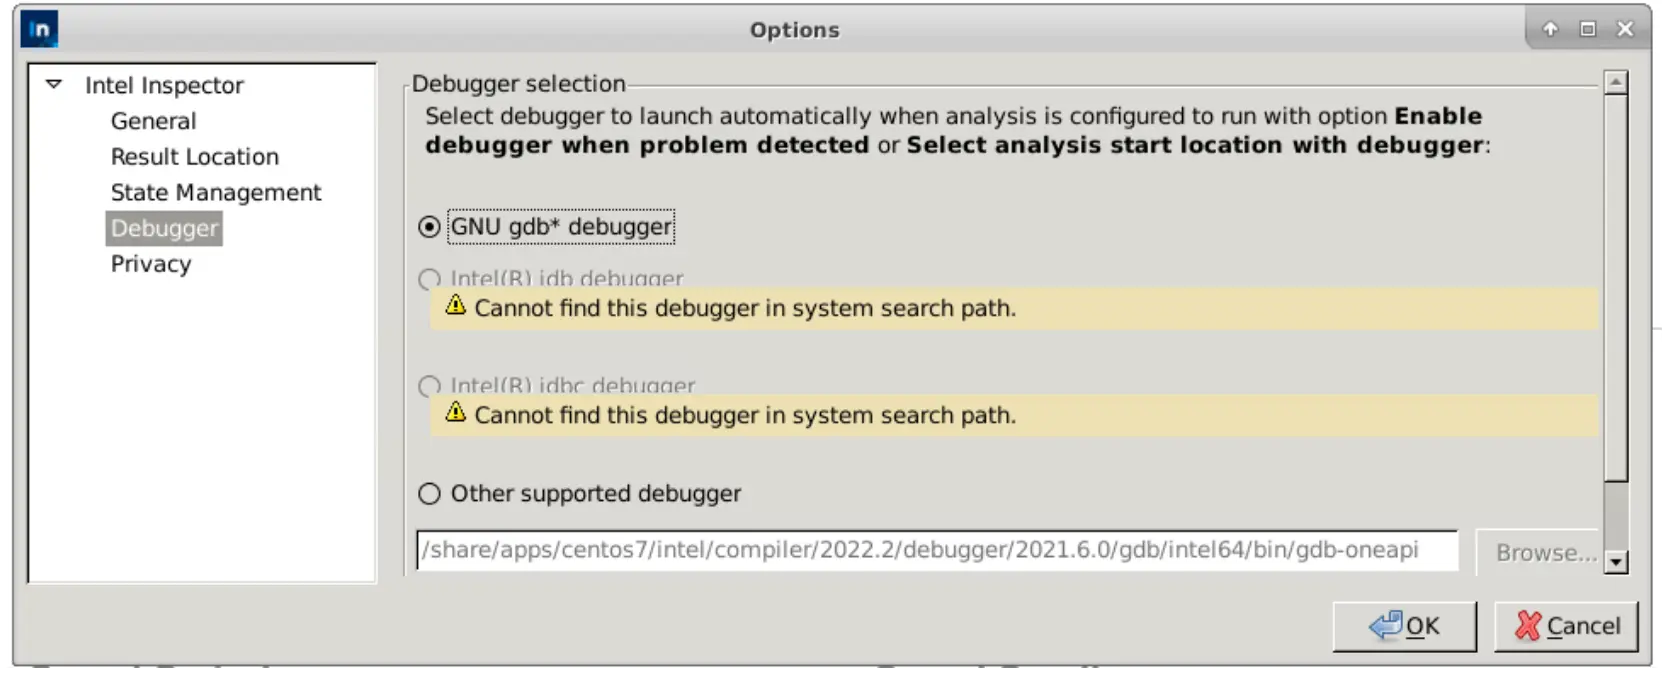
Update the path by running which gdb-oneapi when newer versions are released. Future releases of Inspector may automate this process.
Debugging Process
When configuring the analysis, there are two available options:
- Enable debugger when problem detected: Stops at every error found for consecutive issue investigation.
- Select analysis start location with debugger: Runs the program without analysis until enabled, allowing quick navigation to breakpoints.
Several in-depth walkthroughs and tutorials on using gdb can be found
online. For a quick start to an interactive debugging session, you can use
the following commands:
step           # to go to next instruction
next           # similar to step, but does not go inside functions
continue       # resumes normal execution
backtrace      # displays the call stack
backtrace full # also shows local variables in the call stack
Consult the official documentation for more information on how to use interactive debugging in project development.
Using Inspector with MPI
Intel Inspector can be used to analyse the correctness of MPI applications at the intra-process level, while Intel Trace Analyzer and Collector tool is used for inter-process level analysis. Intra-process parallelism analysis focuses on performance with Intel VTune Profiler and correctness with Intel Inspector within individual processes, which often use fork-join threading through OpenMP or Intel oneTBB.
The intra-process MPI analysis workflow consists of three main steps:
data collection using amplxe-cl and inspxe-cl command-line tools,
post-processing (finalisation or symbol resolution) of the collected data,
and analysing data through the GUI standalone viewer for each process. Note
that there are certain limitations for MPI profiling support, such as no
support for MPI dynamic processes, and hardware event-based sampling collector
limitations.
To collect correctness data for an MPI application with Intel Inspector, use the following command:
mpirun -n <N> inspxe-cl -r my_result -collect <analysis type> my_app [my_app_options]
Result directories are created for each analysed process in the job, named
as my_result.0 - my_result.3. To collect data for a subset of MPI
processes, use the per-host syntax of mpirun/mpiexec.
When using Inspector with MPI, consider passing the -quiet/-q option
to inspxe-cl to prevent excessive diagnostic output from cluttering the
console. Additionally, employ the -l option for mpiexec/mpirun to
label "stdout" lines with their corresponding MPI rank.
Conclusion
In this post, we have provided an overview of Intel Inspector and its role in detecting and diagnosing memory and threading errors in HPC applications. We've covered the integration process on Apocrita, outlining three distinct strategies. Additionally, we expanded on setting up the GUI, a real-world example of detecting and fixing issues, and interactive debugging. Moreover, we have briefly discussed how Intel Inspector can be used with MPI applications to analyse their correctness at the intra-process level.
While we touched on the key features and techniques, some topics like handling regressions and suppression were not covered in detail. These themes can be explored further in the official Intel Inspector documentation and other available resources.
As always, the Research Software Engineering (RSE) team is here to help you with any issues or questions related to the topics covered in this post. Feel free to reach out to us for assistance with Intel Inspector, performance optimization, or any other challenges you may encounter in your projects.
Appendix
Setting up and using the local Inspector client
Follow the installation instructions in the standalone version or HPC Toolkit version links. Connect to Apocrita using:
ssh -XY apocrita
or, alternatively, add ForwardX11 yes in the SSH config file.
Constant forwarding may impact your bandwidth to and from Apocrita.
After logging in, load the necessary modules and launch the
Inspector GUI with inspxe-gui. Use the GUI to view analysis results
from the directory where they are saved. However, avoid starting new
analyses using the local Inspector client as you are connected directly
to the frontend.
Sample job script
#!/bin/sh
#$ -cwd
#$ -j y
#$ -pe smp 4
#$ -l h_rt=240::
#$ -l h_core=1G
#$ -l h_vmem=3G
#$ -N intelInspector

module load intel/2022.2 inspector # load the modules in order
ulimit -s unlimited                # no stack size limit
export OMP_NUM_THREADS=${NSLOTS}   # number of OpenMP threads
export OMP_STACK_SIZE=512M         # size of stack size for OpenMP threads
export SRCA=/data/home/user/path/to/source/dir/
export SRCB=/data/home/user/path/to/objects/dir/
export SRCC=/data/home/user/path/to/binary/dir/
# collect memory leaks: mi1, mi2, mi3
# collect data races, deadlocks: ti1, ti2, ti3
# search [r]ecursively, [p]riority

inspxe-cl -collect ti1 \
-search-dir src:r=${SRCA} \
-search-dir sym:r=${SRCB} \
-search-dir bin:r=${SRCC} \
-- ${SRCC}/program
Title image: Generated by Simon Butcher, using Stable Diffusion.