Productivity tips for Apocrita cluster users

This article presents a selection of useful tips for running successful and well-performing jobs on the QMUL Apocrita cluster.
In the ITS Research team, we spend quite a bit of time monitoring the Apocrita cluster and checking jobs are running correctly, to ensure that this valuable resource is being used effectively. If we notice a problem with your job, and think we can help, we might send you an email with some recommendations on how your job can run more effectively. If you receive such an email, please don't be offended! We realise there are users with a range of experience, and the purpose of this post is to point out some ways to ensure you get your results as quickly and correctly as possible, and to ease the learning curve a little bit.
1. Use the short queue to check your jobs start successfully
If you have a large job that requires a longer queueing time, it must be hugely
frustrating to wait a day for your job to start running, only to see it die
immediately due to a typo in your job script. You might be unaware that if you
set -l h_rt=1:0:0 in your job script (to specify a maximum running time of 1
hour), your job will often start running immediately, since we have a "short
jobs" queue available on some additional nodes which usually have a few idle
cores. Once you have verified everything is working, you can stop the job with
qdel <jobid> command, and submit your original job with the full time limit.
2. Quick interactive work
If you need to do some interactive work in order to perform a quick ad hoc
computation, or check/debug issues in your job script, then the qlogin
command will give you a session on a compute node. By default this will request
1 hour runtime, so you will usually get some free resources immediately on the
short queue, e.g. qlogin -pe smp 2 -l h_vmem=1G will give you a 2 core session
with 2G total RAM for 1 hour on the short queue. Please don't use the frontend
servers for such work, as there are usually 100+ users on the frontend at any one
time, and you may impact the service for everybody.
3. Use 1 hour or 10 days for your maximum runtime value
While the number of cores and RAM quantity will impact the queueing time significantly, the maximum runtime has a very low impact on the queueing time. Since the job scheduler will kill a job that exceeds the runtime value, for most users the best thing to do is specify either:
- 1 hour (to take advantage of short queue) - this is the default if
h_rtis not specified. - 240 hours (10 days - the maximum runtime).
There are some edge cases that could mean a job with h_rt value of 1 or 3
days will get queued ahead of a 10 day job, but these usually relate to
situations where we have reserved resources at a future date e.g. maintenance
periods. There may also be some small benefit for users who run large
multi-node parallel jobs too, since we commonly reserve resources for large
jobs, but the main thing to remember is that you don't want your job to die due
to some arbitrary limit you have artificially set, so most users should just
set 240 hours, unless they want to access the short queue.
4. Check how many cores your job actually uses
We see a variety of issues where CPU resources are not requested correctly. Understanding how the application works, and requesting correct resources can result in a considerable reduction in waiting time for your research computations. Common issues include:
-
Using fewer cores than requested
A user submits a job requesting 10 cores, but the application can only use 1 core.
This can be verified by running
ssh -t <node> topto show the current CPU activity on a node, where<node>is the machine your job is running on, as shown by theqstatcommand. Runningtop -u $USERwill filter the output for your processes only. Don't forget to exittopwithq.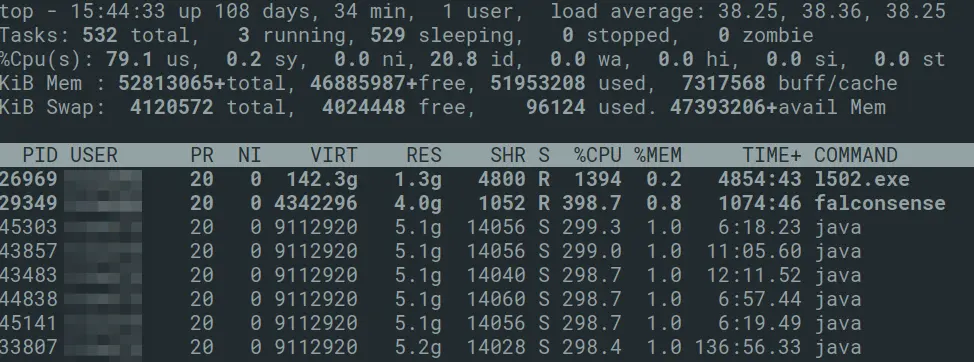 Fig. 1: Output from the
 topcommandIn the above example,
l502.exeis using 1400%, or 14 cores.falconsenseis using 4 cores, and thejavaprocesses are using 3 cores. This corresponded with the number of cores requested for the jobs on that node (verified withnodestatus -N <nodename>), so all processes are correctly using their requested core count at the time of inspection. We also commonly see bioinformatics pipelines which use the full core count for some of the time, but large parts of the pipeline are only utilising 1 core, resulting in comparable overall runtime. -
Attempting to use more cores than requested
The job script requests, for example, 2 cores, but the default behaviour of your application is to run a thread for every core on the machine (maybe 32 or 48). This will slow your job considerably, since dozens of threads will be competing for those two cores.
One clear sign of this happening is the existence of alarms in the
nodestatusoutput, meaning that new jobs will not be scheduled on those nodes until the issue is resolved. To confirm the problem, whiletopmay show a single process using 100% utilisation, pressingHwill show a lot of threads sharing the single core: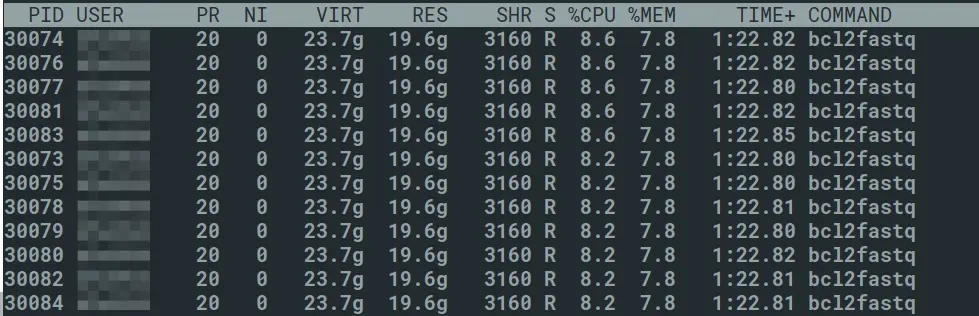 Fig. 2: Many threads running on a single core
Alternatively, running the
pstreeon the parent process will show a lot of child processes. In the below example,PIDis the process identifier of the parent process.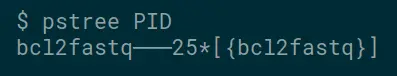
Fig. 3: Output of pstree for a given process ID
Often these applications have an option to specify the number of threads, so it's good practice to check the options for all the applications you use. We try to highlight this option on the specific application page on our documentation site. This particularly seems to affect bioinformatics jobs, but isn't limited to just these applications.
-
Poor CPU scaling
An application may run well on a few cores, but does not scale effectively to many cores, due to storage bottlenecks or a design deficiency. Often it's good to start with a lower core count (for example 1 or 2) and check how the runtime is affected if you scale up to 4, 8 or 16 cores. You can examine output of the
topcommand for CPU usage, but this may vary during different stages of the job.
5. Use scratch and $TMPDIR for job output
Home directories on the cluster are generally designed as smaller personal space to prepare jobs, while the shared Project/Lab directories are the funded and scalable area for longer term storage. The high performance scratch space is ideal for directing large amounts of raw job output for short term storage, ahead of further processing or curating and moving into your project space. Using scratch can have a huge performance boost on very data-intensive workloads, even more so if your workflow incorporates copying data to the local disk for processing during the job, and back again after. The $TMPDIR job scheduler feature automatically deletes the local copy when the job finishes.
6. Check how much memory your job actually used
While it's good to add overhead on the memory requirements for your job,
massively overestimating RAM requirements will impact queueing time
significantly, and block resources from being used by other jobs. It's good
practice to understand how much RAM your completed job used, either by
checking with the qacct or get_job_ram_usage commands, and use this
information for future runs of similar jobs. Documentation for the above
commands can be found on our
documentation site.
Additionally, you can see a detailed summary of your recent jobs on our
stats site.
7. Use array jobs (but turn off mail options)
Array jobs are a neat way of running application on a batch of input data. While they look a little scary at first, they are very powerful once you get the hang of them, and provide you with a greater level of organisation and control over batches of similar jobs. Some things to note about job arrays:
- Resource requests should be sized for an individual task - e.g. RAM requirements are not the total over the whole array, but the requirement to run a single task.
- If you have a very large job requiring a long computation or huge RAM, consider if you can break it up into a bite-size array - you will certainly benefit from lower queueing time.
- Since each task is run separately, please remember not to request email notifications in large arrays - thousands of emails arriving in a short space of time will jam the email queues for everyone, and you will also have to spend a lot of time deleting emails from your inbox!
- If your array job is data-intensive, you will need to apply a concurrency limit to the number of array tasks that run at once, to avoid impacting the storage system adversely.
- Check that your array works properly with one or two tasks before submitting your 100,000 task array, in case an error in your job causing 100,000 immediate task failures.
8. The parallel queue is for multi-node MPI jobs
Many applications can scale to multiple cores, but only specialist parallel
applications, such as those utilising MPI, can use multiple nodes - effectively
as one large computer. If you don't know what MPI is, it's likely that your
application cannot use more than one node at once. To ensure you are only
running on a single node, request the smp environment (i.e. -pe smp 2).
You should also limit your core count request to fit within a single node.
9. Don't be too restrictive with node type
Unless you have a good reason, you shouldn't try to artificially restrict the set of nodes your job runs on, as it will likely result in a longer queueing time. Exceptions to this rule could be:
- you need to run on a node with AVX2 processor extensions
- running on a slower node will exceed the maximum 10 day runtime
- your job requires a large amount of RAM (e.g. consistently above 128GB used) and you require high memory nodes
- you have purchased a node/nodes and have a batch of jobs you want to ensure
runs there. This is achieved using the
-l ownedoption in a job script
10. Seek advice about your code or job scripts
It may be that you have written some code that could do with some expert advice. Our Research Software Engineering team can help your research project by offering code reviews, and looking at possible optimisations.
11. Compress your data to save storage costs
Using a fast
compression
tool such as zstd (available as a module) on
your data will reduce storage costs and time to transfer data over the network.
If you share data (either residing on Apocrita or elsewhere) with researchers
outside of QMUL, we recommend speaking to us about how the Globus application can facilitate this.
We hope you find these tips useful. As usual, you can ask a question on our slack channel, or sending an email to its-research-support@qmul.ac.uk which is handled directly by staff with relevant expertise.
Title image: Isaac Smith on Unsplash